[ad_1]
U.S. yields were little changed to slightly lower Friday morning, with 10- and 30-year rates remaining near their highest levels since 2007 and 2011.
What’s happening
-
The yield on the 2-year Treasury
BX:TMUBMUSD02Y
was 4.923%, down 3.6 basis points from 4.959% on Thursday. -
The yield on the 10-year Treasury
BX:TMUBMUSD10Y
was 4.262%, down 4.5 basis points from 4.307% Thursday afternoon. Thursday’s level was the highest since Nov. 7, 2007, based on 3 p.m. data from Dow Jones Market Data. -
The yield on the 30-year Treasury
BX:TMUBMUSD30Y
was 4.391%, down 2 basis points from 4.411% late Thursday. It finished Thursday at the highest level since April 28, 2011.
What’s driving markets
The big story in financial markets is that longer-term debt continues to decline in value, with yearly returns in the Treasury market slipping into negative territory this week. The selloff has pushed 10- and 30-year yields to their highest closing levels in over a decade on Thursday.
Read: Treasury market returns are negative again. Why this time for bonds looks different than 2022.
U.S. economic data released this week — notably retail sales, industrial production and weekly jobless claims — pointed to a surprisingly resilient U.S. economy after a series of Federal Reserve interest rate increases. There’s no major economic data scheduled to be released on Friday.
Meanwhile, Treasury debt issuance is on the rise to refill the U.S. government’s coffers following the debt-ceiling debate in Congress earlier this year, and the Federal Reserve has been shrinking its balance sheet as part of the central bank’s quantitative-tightening program.
Yields outside the U.S. have also been rising, with the 10-year German bund rate
BX:TMBMKDE-10Y
near its highest level since 2011.
What analysts are saying
“The last few weeks of bond trading have been full of counter-intuitive movements, featuring intra-day spikes and dips that often follow no consistent or coherent narrative. Rather than focus on the day-to-day reactions, it’s worth taking a step back and looking at a slightly longer horizon,” said macro strategist Will Compernolle at FHN Financial in New York.
“The chart below puts recent trading into better context, comparing yield curve changes during the last twenty complete sessions with the twenty right before,” he wrote in a note. “What really sticks out about the yield changes since July 21 is not how much they have gone up, but that it’s been almost entirely focused at the long end of the curve.”
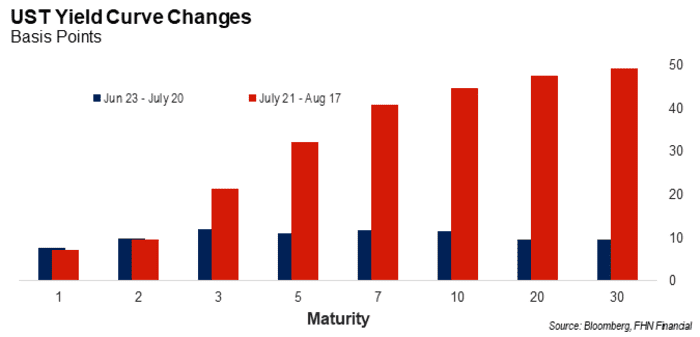
Source: Bloomberg, FHN Financial
[ad_2]
Source link