[ad_1]
Canadian Dollar Outlook:
Loonie Letdown or Liftoff?
In spite of what remains a rather hawkish Bank of Canada, the Canadian Dollar has taken a step backwards in May as a lack of upward momentum in energy prices coupled with eroding risk appetite (see: stocks) has provoked traders to jettison the higher yielding commodity currency. It now appears that the two major CAD-crosses are at an important juncture, with whatever resolution that emerges ultimately paving the path for a meaningful directional move over the coming weeks in both CAD/JPY and USD/CAD rates.
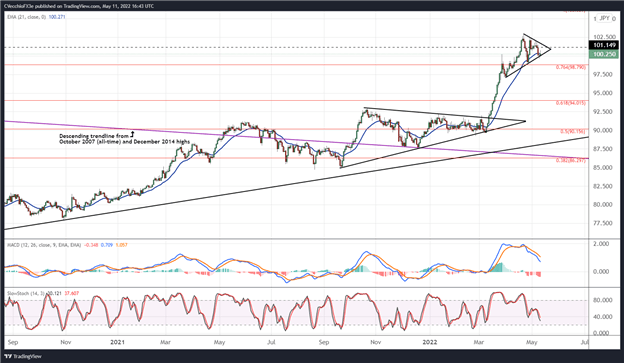
CAD/JPY Rate Technical Analysis: Daily Chart (September 2020 to May 2022) (Chart 1)
Notwithstanding their strong run in 2022 overall, CAD/JPY rates have eased back in May thus far, carving out a symmetrical triangle on the daily timeframe. While a symmetrical triangle following an uptrend would typically be a continuation effort higher, it must be noted that CAD/JPY rates are testing said triangle support, indicating that a potential top may be forming.
CAD/JPY rates are beginning to edge lower below their daily 21-EMA; the daily 5-, 8-, 13-, and 21-EMA envelope is in neither bearish nor bullish sequential order. But daily MACD continues to rise above its signal line, while daily Slow Stochastics are holding in overbought territory. A close below 100.20 this week would increase the likelihood of a pullback to the late-April swing low at 99.01, followed by a move to the late-March swing low (and the base of the triangle support) at 97.05. A move through triangle resistance near 101.50 would increase the likelihood of gains to the base of the triangle resistance at 102.95.
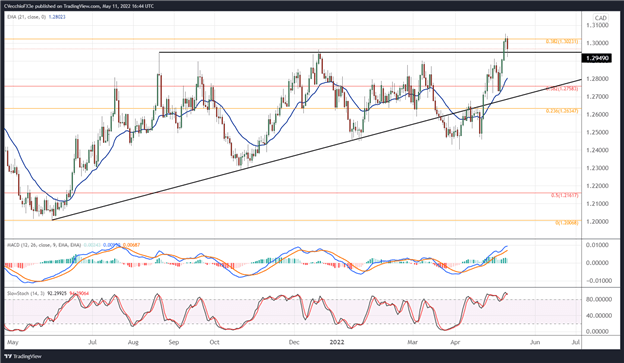
USD/CAD Rate Technical Analysis: Daily Chart (May 2021 to May 2022) (Chart 2)
USD/CAD rates have started to breach ascending triangle resistance at 1.2949/64, whose larger pattern began forming in June 2021. But the gains have been challenged, with selling pressure emerging in the past two sessions; today, however, while initially producing a return into the ascending triangle, has now seen rates return above the 1.2949/64 area.
There are thus two paths forward for USD/CAD rates: this is either the beginning of a more significant bullish breakout that could play out over the next several weeks and months; or a false bullish breakout will have transpired, setting up the potential for a significant reversal lower. In the event of a bullish breakout, the immediate target higher would be the 50% Fibonacci retracement of the 2020 high/2021 low range at 1.3337. In the event of a bearish reversal, a return back to ascending triangle support near 1.2700 would be expected.
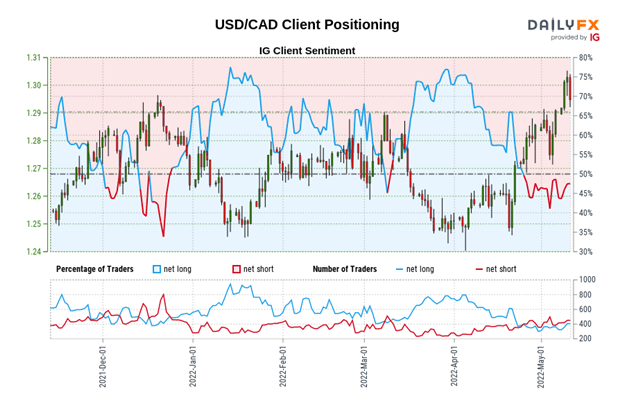
IG Client Sentiment Index: USD/CAD Rate Forecast (May 11, 2022) (Chart 3)
USD/CAD: Retail trader data shows 45.32% of traders are net-long with the ratio of traders short to long at 1.21 to 1. The number of traders net-long is 10.46% lower than yesterday and 10.22% lower from last week, while the number of traders net-short is 18.75% lower than yesterday and 19.24% lower from last week.
We typically take a contrarian view to crowd sentiment, and the fact traders are net-short suggests USD/CAD prices may continue to rise.
Yet traders are less net-short than yesterday and compared with last week. Recent changes in sentiment warn that the current USD/CAD price trend may soon reverse lower despite the fact traders remain net-short.
— Written by Christopher Vecchio, CFA, Senior Strategist
[ad_2]
Source link


