[ad_1]
Pound Sterling (GBP) Analysis
- UK PMI (Flash) data for May revealed the slowest rise in business activity since the global recovery
- Services sector strained by the fastest rise in operating expenses since the index began
- Tracking the chart response for GBP/USD, EUR/GBO and GBP/JPY
Highlights of the S&P Global UK PMI (Flash) Report for May 2022:
- UK private sector firms signalled a sharp slowdown in business activity growth during May as escalating inflationary pressures and heightened geopolitical uncertainty acted as constraints on customer demand.
- Latest data indicated the fastest rise in operating expenses since this index began in 1998
- The report showed the slowest rise in business activity since the current phase of recovery began in March 2021
- The actual figure represents a 6.4 index point drop – 4th largest monthly decline on record
Customize and filter live economic data via our DaliyFX economic calendar
Market Reaction Across Selected Sterling Crosses
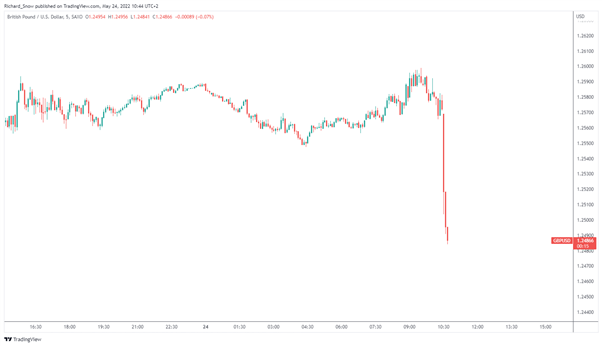
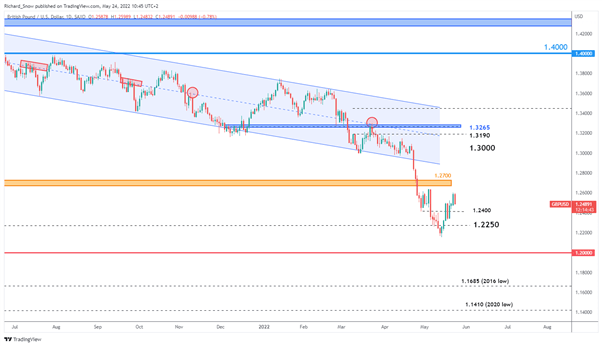
In the aftermath of the negative surprise, the already weakened pound lost ground to the US dollar. Over a long term horizon,
the pound has weakened against the dollar as the Fed accelerated rate hiking plans to combat inflation.
GBP/USD 5-Minute Chart
Source: TradingView, prepared by Richard Snow
Over the shorter term, a much softer dollar has allowed the pound to recover some of its losses, but the shocking PMI release has halted the recent sterling appreciation. 1.2400 becomes a level of interest if it is to halt further bearish price action.
GBP/USD Daily Chart
Source: TradingView, prepared by Richard Snow
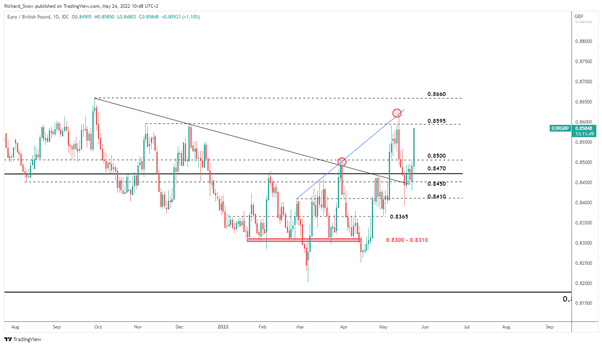
The euro has emerged as a surprising beneficiary of the sterling sell-off given. However, euro sentiment has turned hawkish recently as a number of ECB officials have communicated a preference for a July rate hike – with one member in particular not ruling out a 50 bps hike. In addition, the Bank of England foresees an economic contraction on the horizon for the UK while the ECB has played down recessionary risks for the region as despite struggling to distance themselves from Russian oil and gas purchases. 0.8595/0.8600 remains a key level if the recent EUR/GBP rise is to continue.
EUR/GBP Daily Chart
Source: TradingView, prepared by Richard Snow
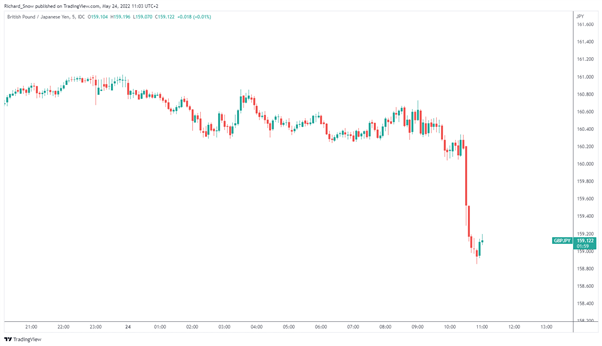
The GBP/JPY chart declined by around 200 pips, or around 1.25%, in the aftermath of the PMI print.
GBP/JPY 5-Minute Chart
Source: TradingView, prepared by Richard Snow
— Written by Richard Snow for DailyFX.com
Contact and follow Richard on Twitter: @RichardSnowFX
[ad_2]
Source link


