
[ad_1]
Gold Technical Price Forecast: XAU/USD Weekly Trade Levels
Gold prices plunged 0.5% this week with XAU/USD on pace for a third consecutive weekly sell-off into the close of June. The decline takes prices below a key support pivot we’ve been tracking for months now and the threat remains for a deeper correction towards longer-term uptrend support heading into the July / Q3 open. These are the updated targets and invalidation levels that matter on the XAU/USD weekly technical price chart. Review my latest Weekly Strategy Webinarfor an in-depth breakdown of thisgold technical setup and more.
Gold Price Chart – XAU/USD Weekly
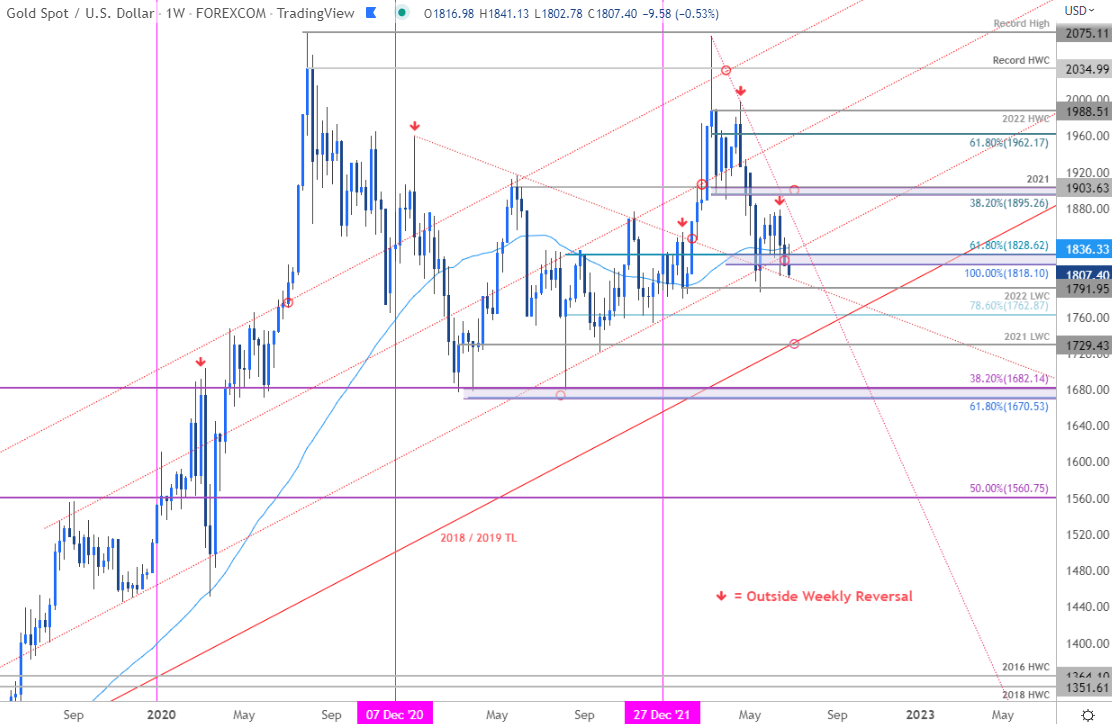
Chart Prepared by Michael Boutros, Technical Strategist; Gold on Tradingview
Notes: In my last Gold Weekly PriceOutlook we noted that XAU/USD had, “defended medium-term support at 1818/33 for a second time with an outside-weekly reversal off the lows (and an outside daily reversal on Friday) further defining this key threshold.” Gold is attempting to break below this key zone at the 100% extension of the yearly decline / 61.8% Fibonacci retracement of the 2021 rally yet again this week and the focus is on the monthly / weekly close with respect to 1818/33.
A downside break exposes the yearly low-week close at 1791 backed by the 78.6% retracement at 1762. Critical support rests with the 2021 low-week close which converges on the 2018 / 2019 trendline near 1729– we continue to reserve this threshold as our broader bullish invalidation level (area of interest for possible downside exhaustion IF reached. Initial weekly resistance now stands with the 52-week moving average (currently near 1836) backed by yearly trendline resistance (~1870s) with a breach / close above 1895–1903 needed to mark resumption of the broader multi-year uptrend in gold.
Bottom line: Gold is threatening a break below key technical support and the focus is on the monthly / weekly close with respect to 1818/28 for guidance. From a trading standpoint, a good zone to reduce short-exposure / lower protective stops heading into the close of the month. Ultimately, heading into the July open we’ll be on the lookout for a breakout of the 1791-1836 range for broader guidance with our focus on identifying a possible exhaustion low in Q3. Review my latest Gold Price Outlook for a closer look at the near-term XAU/USD technical trade levels.
For a complete breakdown of Michael’s trading strategy, review his Foundations of Technical Analysis series on Building a Trading Strategy
Gold Trader Sentiment – XAU/USD Price Chart

- A summary of IG Client Sentiment shows traders are net-long Gold- the ratio stands at +6.22 (86.15% of traders are long) – typically bearishreading
- Long positions are1.15% higher than yesterday and 10.64% higher from last week
- Short positions are 8.09% lower than yesterday and 20.81% lower from last week
- We typically take a contrarian view to crowd sentiment, and the fact traders are net-long suggests Gold prices may continue to fall. Traders are further net-long than yesterday and last week, and the combination of current positioning and recent changes gives us a stronger Gold-bearish contrarian trading bias from a sentiment standpoint.
—
Active Weekly Technical Charts
– Written by Michael Boutros, Technical Strategist with DailyFX
Follow Michael on Twitter @MBForex
[ad_2]
Source link