
[ad_1]
US Dollar Vs Euro, British Pound, Japanese Yen – Outlook:
- USD is struggling at key resistance ahead of Powell speech on Friday.
- EUR/USD and GBP/USD are near key support, while USD/JPY is testing a vital hurdle.
- What is the outlook and the key levels to watch for EUR/USD, GBP/USD, and USD/JPY?
Recommended by Manish Jaradi
Traits of Successful Traders
The US dollar’s rally looks tired against some of its peers ahead of the Jackson Hole Economic Symposium beginning Thursday.
US Federal Reserve Chair Jerome Powell is due to speak on Friday at the three-day meeting of central bankers. He may provide an updated economic assessment. Above-expected industrial production and retail sales, solid housing starts raise the odds that inflation ticked higher in July, suggesting the need for additional tightening. However, Powell could reiterate a data-dependent approach instead of pointing to any firm commitment. With speculative USD positioning now mildly long from shorts recently, a balanced assessment could provide an excuse for unwinding some of those longs.
DXY Index Daily Chart
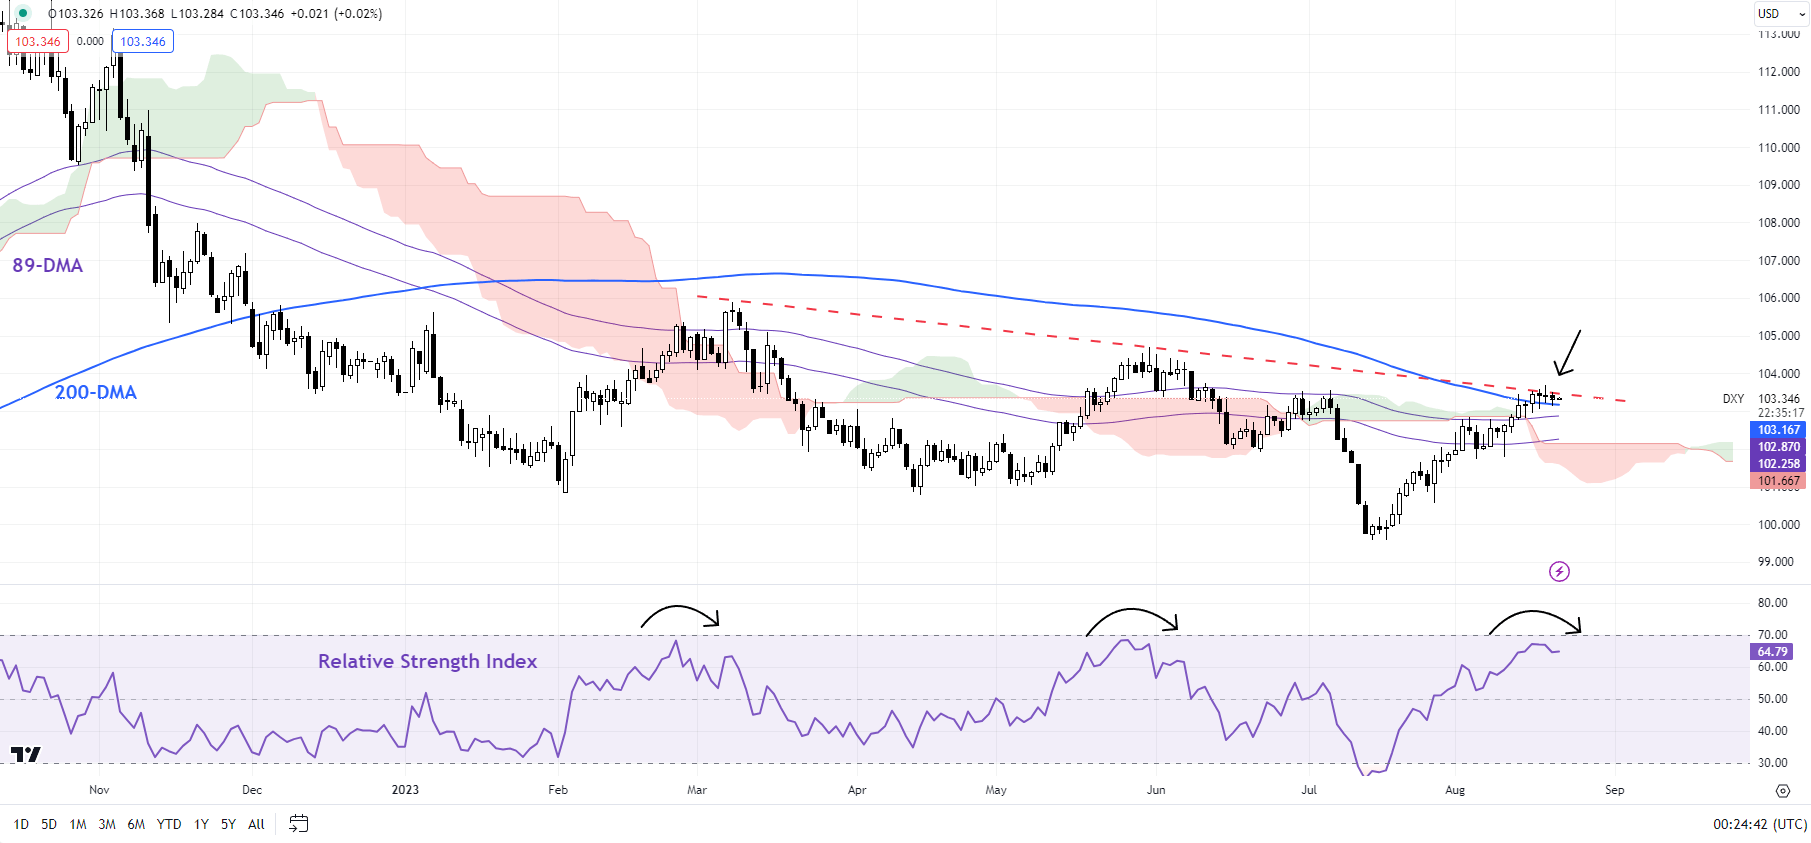
Chart Created by Manish Jaradi Using TradingView
On technical charts, the US dollar’s global rally appears to be running out of steam. The DXY Index is testing a tough ceiling on the 200-day moving average and a downtrend line from early 2023. So far, the rally from last month looks corrective – the index would need to clear the early-2023 highs of 105.50-106.00 for the broader bearish picture to reverse.
EUR/USD Daily Chart
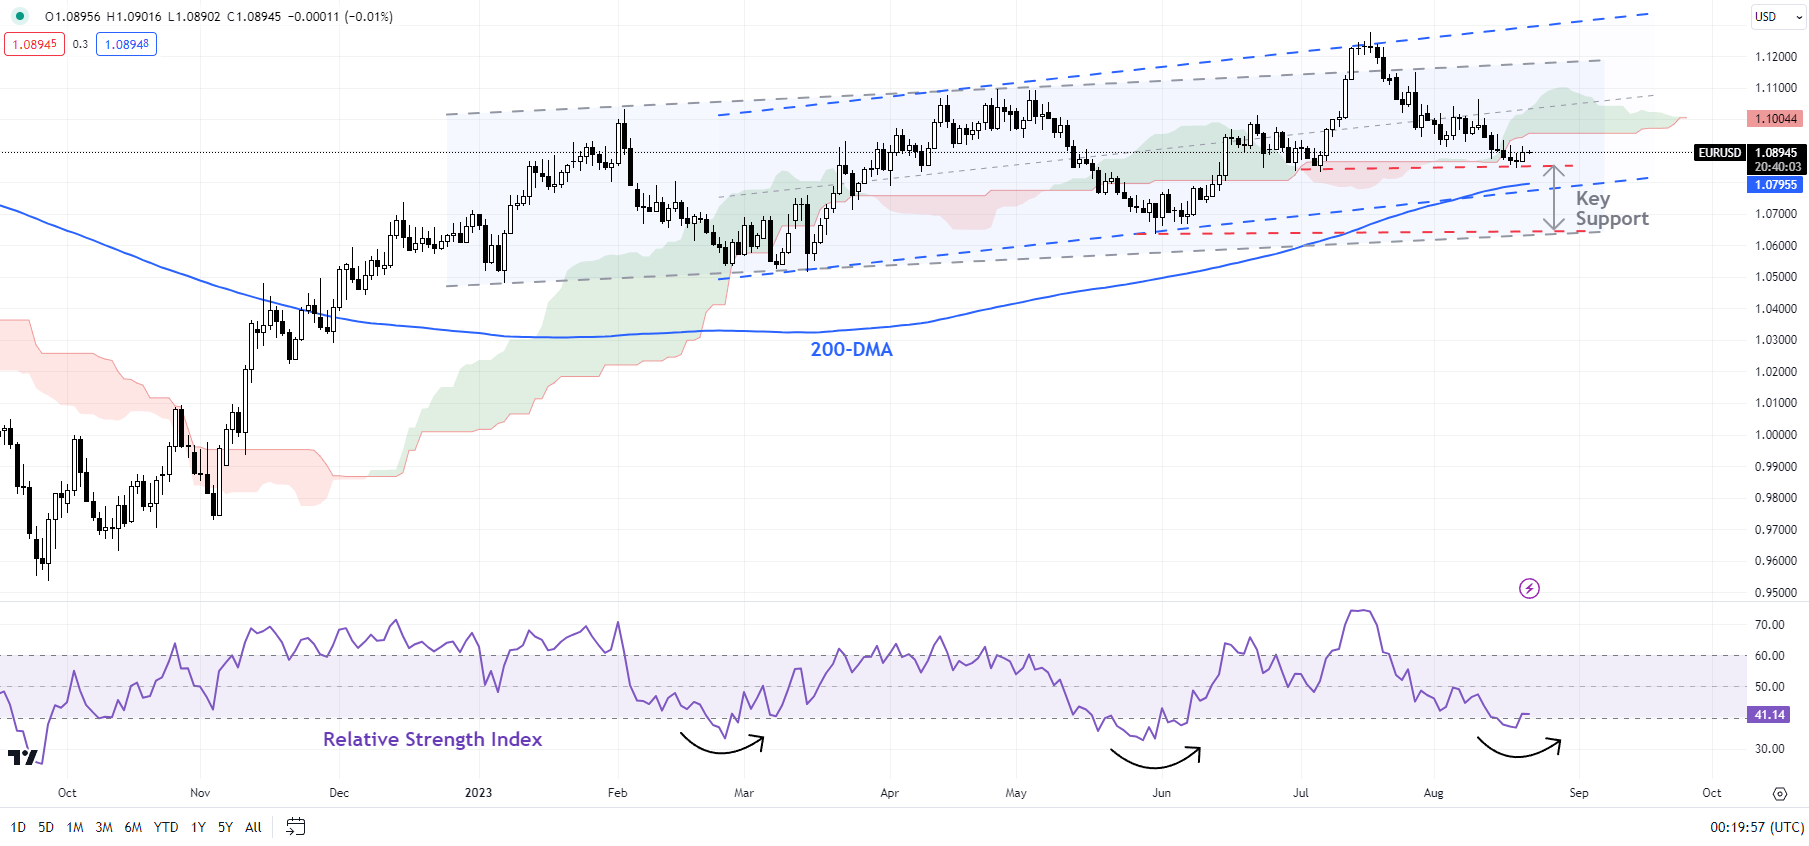
Chart Created by Manish Jaradi Using TradingView
EUR/USD: Ample cushion on the downside
EUR/USD is now entering a major converged floor which could contain the downside for now. This includes the 89-day moving average, the 200-day moving average, and the lower edge of the Ichimoku cloud on the daily chart. For the broader bullish trend to ease, the pair would need to crack below the 2023 lows of around 1.0500. On the upside, there is a stiff hurdle at the August 10 high of 1.1065. A break above the resistance is needed for the downside risks to dissipate.
GBP/USD Daily Chart
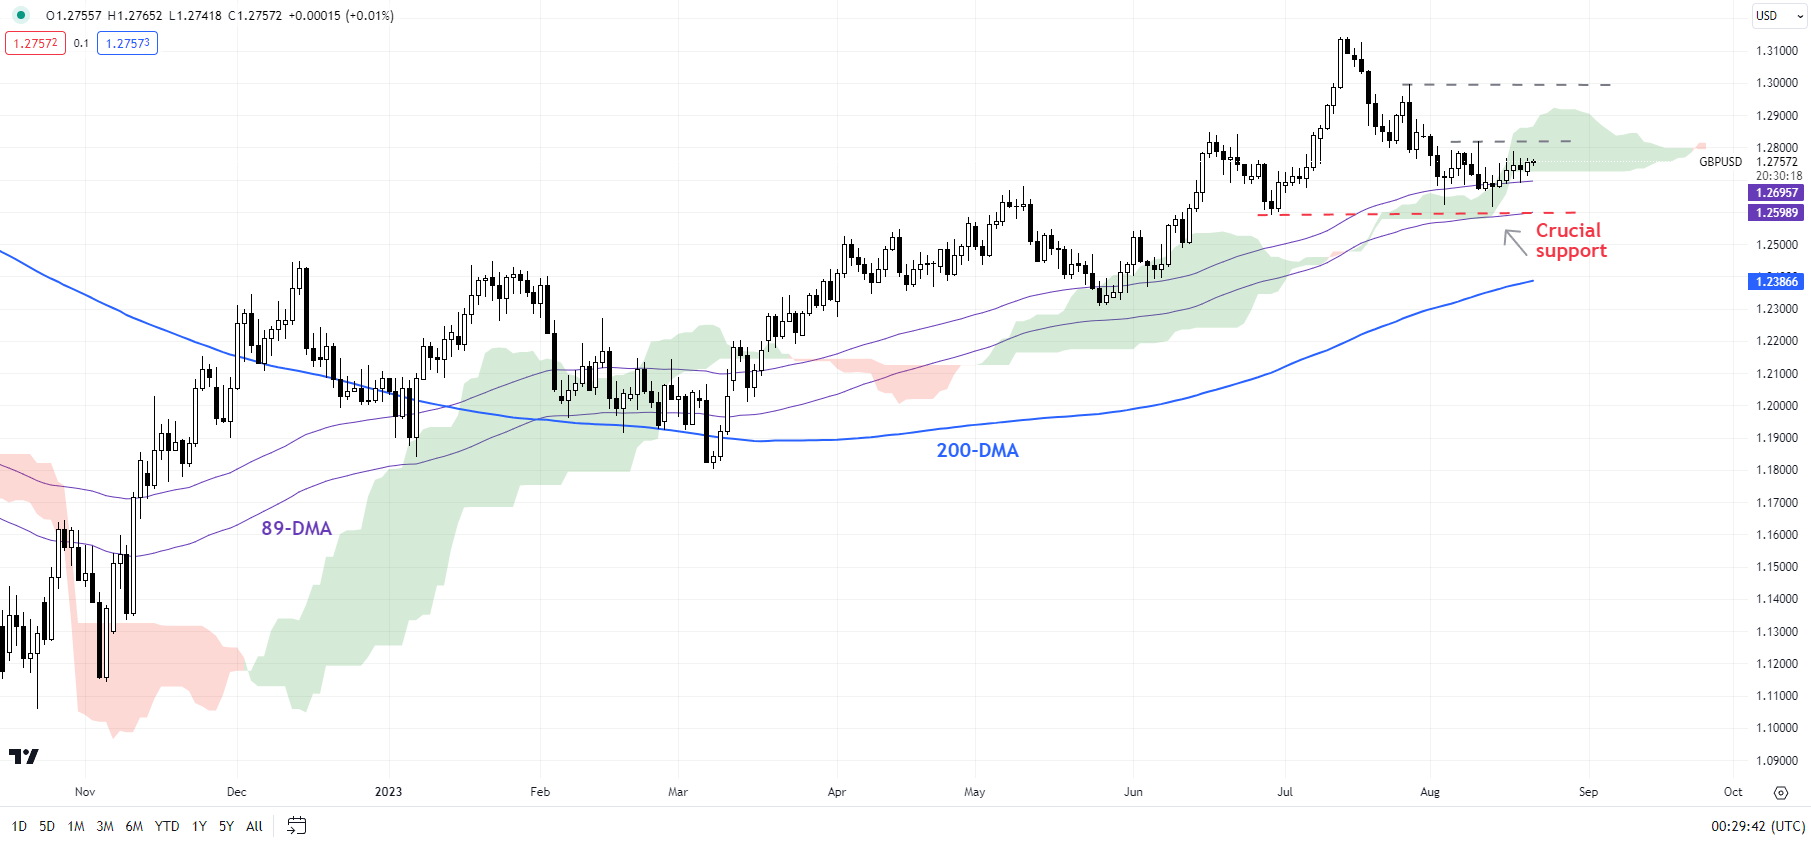
Chart Created by Manish Jaradi Using TradingView
GBPUSD: No threat to uptrend yet
GBP/USD is so far holding above fairly strong converged support around 1.2600 – the 89-day moving average, the lower edge of the Ichimoku cloud on the daily chart, and the end-June low of 1.2600. Even if this floor breaks, there is stronger support on the 200-day moving average and the May low of 1.2300 – only a fall below this would raise the risk of an extended consolidation in the broader rally. On the upside, GBP/USD needs to rise above the August 10 high of 1.2820 for the immediate downward pressure to fade. Zooming out, the broader bias remains up, with a potential to rise toward 1.4200 in the coming months (see theprevious updatefor more details).
USD/JPY Daily Chart
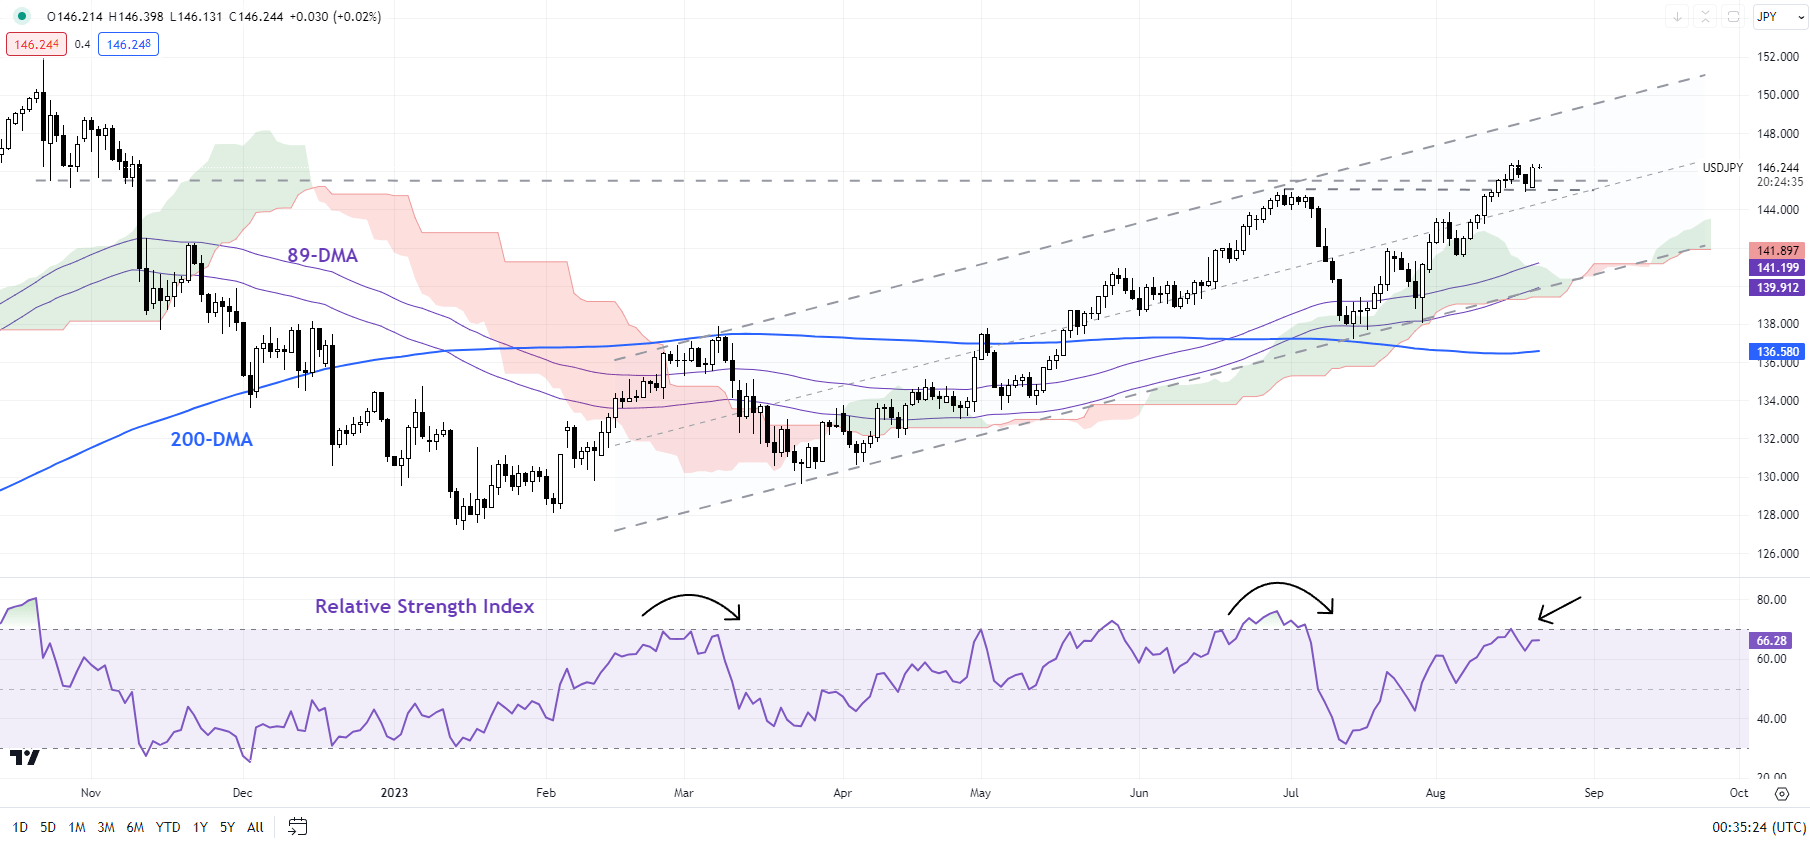
Chart Created by Manish Jaradi Using TradingView
USD/JPY: Overbought at key resistance
USD/JPY looks overbought as it tests a crucial barrier around 145.00-145.10, including the June high and the end-October 2022 low. The 14-day Relative Strength Index appears to be rolling over from the overbought territory – as the accompanying chart shows, on previous occasions such a rollover was associated with a retreat in USD/JPY. Still, for any retreat to be meaningful, the pair needs to break below immediate support at the mid-August low of 145.00. Such a break would be a warning sign for the five-week uptrend.
Recommended by Manish Jaradi
Improve your trading with IG Client Sentiment Data
— Written by Manish Jaradi, Strategist for DailyFX.com
— Contact and follow Jaradi on Twitter: @JaradiManish
[ad_2]
Source link