[ad_1]
Australian Dollar Technical Price Outlook: AUD/USD Weekly Trade Levels
- Australian Dollar technical trade level update – Weekly Chart
- AUD/USD plunges 8.8% off yearly high- bears now testing critical multi-year support pivot
- Aussie resistance 7170s, 7270(key), 7385- Support 6991-7016 (critical), 6770s, 6660/70
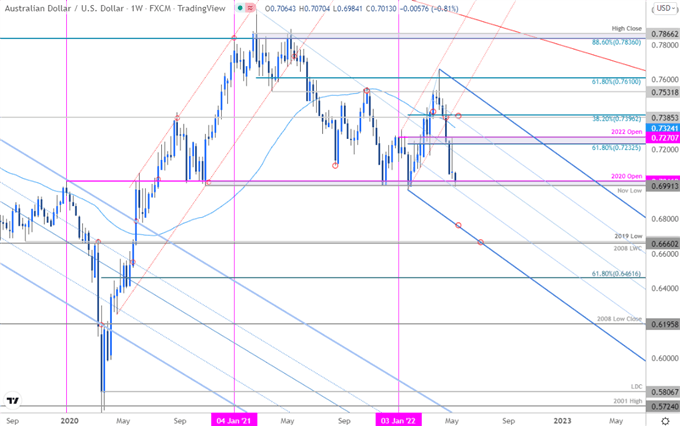
The Australian Dollar is on the defensive into the start of the week with a massive sell-off from the yearly highs taking Aussie into critical support at last year’s low in just five weeks. The battle-lines are drawn with the focus on a reaction off this key support zone this week. These are the updated targets and invalidation levels that matter on the AUD/USD weekly price charts. Review my latest Weekly Strategy Webinar for an in-depth breakdown of this Aussie technical setup and more.
Australian Dollar Price Chart – AUD/USD Weekly
Chart Prepared by Michael Boutros, Technical Strategist; AUD/USD on Tradingview
Notes: In last month’s Australian Dollar Technical Forecast we highlighted the threat for a correction in AUD/USD after marking a fresh yearly high. We noted that, “losses should be limited to 7385 for the long-bias to remain viable.” Aussie crashed through this support zone in late-April with the decline plunging more than 8.8% off the yearly high. Price is now testing a critical support zone we’ve tracking for years now at 6991-7016– a region defined by the November 2020 swing low, the objective 2020 yearly open, the 2021 lows and the 2022 low-week close. This is technically significant range and we’re looking for possible price inflection here in the days ahead.
AUD/USD is trading within the confines of a newly identified descending pitchfork formation extending off the 2021/2022 highs with the 25% parallel further highlighting support key technical support. A break lower from here would likely fuel another accelerated sell-off with such a scenario exposing the lower parallel (currently near ~6770s) and the 2008 low-week close / 2019 low at 6660/70– look for a larger reaction there IF reached. Initial resistance now back at the median-line (currently near ~7170s) backed by the objective yearly open at 7270 – a breach / weekly close above would this threshold would be needed to shift the medium-term focus higher again.
Bottom line: The Australian Dollar has plummeted into a critical support pivot and the immediate focus is on a reaction off this mark. From a trading standpoint, a good zone to reduce portions of short-exposure / lower protective stops – rallies should be limited to the median-line IF price is heading lower on this stretch with a close sub-6991 needed to keep the immediate decline viable. Stay tuned! Review my latest Australian Dollar Price Outlook for a closer look at the near-term AUD/USD technical trade levels.
For a complete breakdown of Michael’s trading strategy, review his Foundations of Technical Analysis series on Building a Trading Strategy
Australian Dollar Trader Sentiment – AUD/USD Price Chart
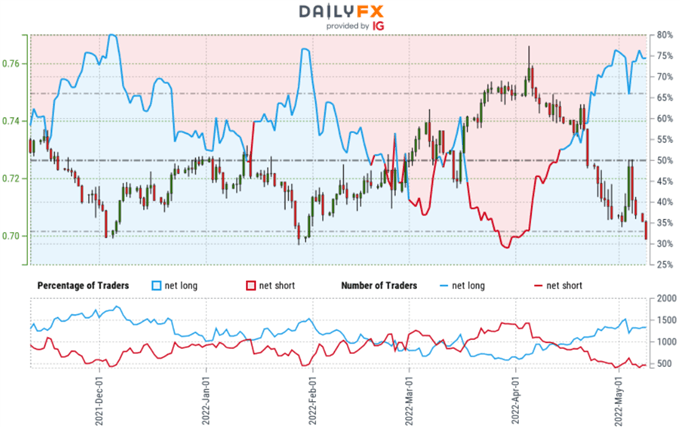
- A summary of IG Client Sentiment shows traders are net-long AUD/USD – the ratio stands at +2.92 (74.48% of traders are long) – typically bearish reading
- Long positions are 10.85% higher than yesterday and 1.45% higher from last week
- Short positions are1.00% higher than yesterday and 3.28% higher from last week
- We typically take a contrarian view to crowd sentiment, and the fact traders are net-long suggests AUD/USD prices may continue to fall. Trader are more net-long than yesterday but less net-long from last week. The combination of current positioning and recent changes gives us a further mixed AUD/USD trading bias from a sentiment standpoint.
—
Australia / US Economic Calendar
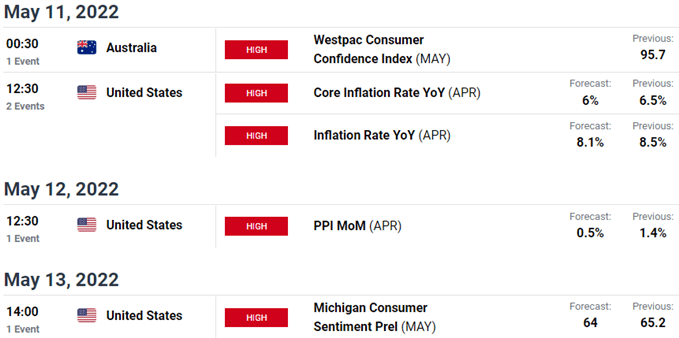
Economic Calendar – latest economic developments and upcoming event risk.
Previous Weekly Technical Charts
— Written by Michael Boutros, Technical Strategist with DailyFX
Follow Michael on Twitter @MBForex
[ad_2]
Source link


