[ad_1]
WTI Crude Oil, Brent Oil, China, Covid, API, EIA, Inventory – Talking Points
- China’s “Zero-Covid” strategy grips Beijing as cases surge prompting demand-side worries
- US inventory data from the API and EIA in focus over the coming days after export surge
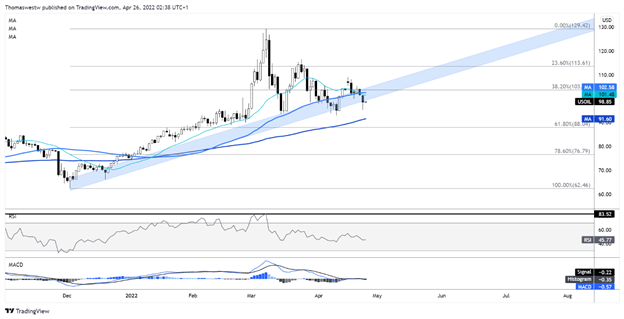
- WTI prices threaten to piece below a supportive trendline, exposing the 100-day SMA
Crude oil prices are steadying after starting the week off with a big move lower on Chinese lockdown fears. Brent crude prices slipped nearly 4% on Monday, while the WTI US benchmark lost just over 3%. The downside came after Beijing announced that it would widen the city’s Covid-19 lockdown, prompting demand-side fears across the commodity market.
The demand picture for oil was already weakening due to the prolonged lockdown in Shanghai earlier this month. Meanwhile, China’s central bank has taken steps to ease financial conditions in the country, although it wasn’t enough to ward off a selloff in Chinese equities on Monday. The People’s Bank of China will likely continue to roll out supportive actions over the coming weeks and months, but those actions may have little effect until China’s major cities are free from the threat of lockdowns.
Oil traders will be watching inventory data this week to gauge the supply side of the equation for prices. The American Petroleum Institute (API) will report US stocks for the week ending April 22. As usual, the Energy Information Administration (EIA) will follow up with its own inventory report on Tuesday night. Analysts expect the EIA data to show a draw of 0.3 million barrels for the same period.
That would constitute a much smaller reduction in inventories than the week prior when the US reported record exports. That export strength is likely due to foreign buyers sourcing US oil to make up for the shortfall of Russian products on the market amid sanctions. The European Union is preparing another package of sanctions against Russia, but they may hold off on directly targeting oil exports for the time being.
WTI Crude Oil Technical Outlook
WTI prices appear to be on the verge of breaking a supportive trendline from the December swing low. The next level of potential support below the trendline is the rising 100-day Simple Moving Average (SMA). The 20-day SMA crossed below the 50-day SMA last week, a bearish sign. The Relative Strength Index (RSI) and MACD oscillators both crossed below its centerlines, also a bearish momentum signal. That said, the path of least resistance looks to be to the downside.
WTI Oil Daily Chart

Chart created with TradingView
— Written by Thomas Westwater, Analyst for DailyFX.com
To contact Thomas, use the comments section below or @FxWestwater on Twitter
[ad_2]
Source link