[ad_1]
S&P 500, Dollar, VIX, Fed Forecast and Monetary Policy Talking Points:
- The Market Perspective: USDJPY Bearish Below 137; EURUSD Bullish Above 1.0000; S&P 500 Bearish Below 4,030
- The DXY Dollar Index’s three-day slide through its 200-Day SMA last week has rendered a hefty 0.8 percent rally today, but is that a trend-stopping move?
- While the S&P 500 managed to hold up above its own 200-Day SMA Friday, we have crashed back below the prominent technical level and back into the narrow range of the previous weeks
Recommended by John Kicklighter
Building Confidence in Trading
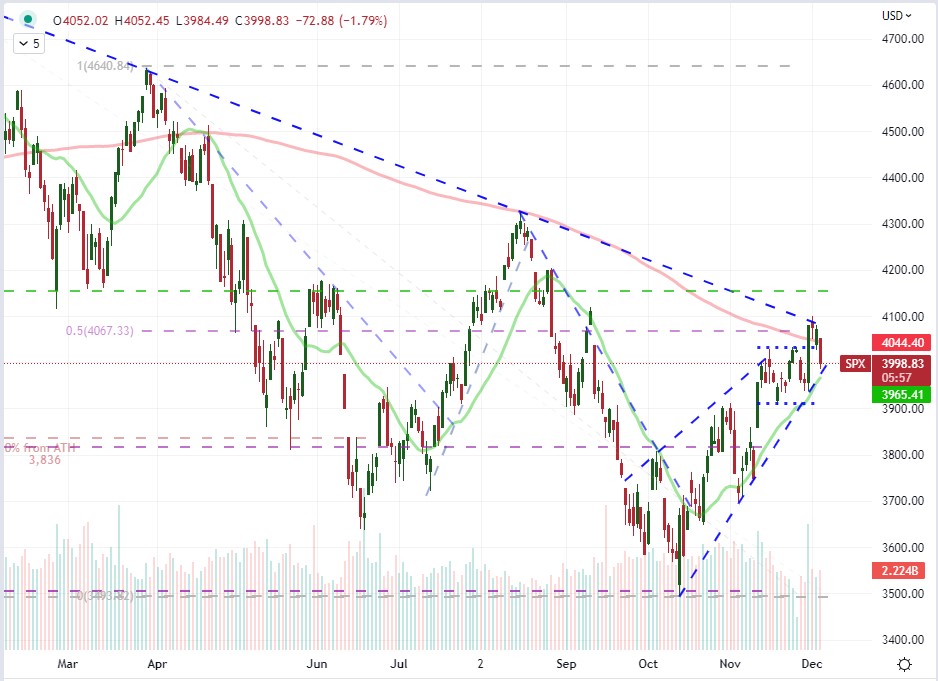
The speculative charge that we had initially witnessed through the middle of last week didn’t exactly reach a rolling momentum heading into the weekend. For risk-leaning assets such as US indices, the technical breakout stalled quickly after launch and maintained some serious overhead resistance. In comparison, the Dollar’s slide was managed to achieve a little more traction in its own slide to five-month lows and through the closely-watched 200-day SMA (on the DXY Index). Both moves have experienced a correction to start the week, opening up discussion as to what the prevailing trend is versus the counter move. Big picture, 2022 has seen an overall bear trend for the S&P 500 – as a benchmark for ‘risk’ – both in the technical sense (20 percent correction from all-time highs) and generalized market participant assessment. Therefore, the -1.8 percent drop from the index Monday could be viewed as simply returning to the prevailing trend or a pullback within the context of the past two month’s rising wedge. This is where technicals can exert a little more influence on bias. While there remains notable fundamental event risk to generate volatility, the heavy-hitting stuff is expected next week. Therefore, for now, my focus remains on the 20-day SMA and wedge floor from the October 13th low at 3,965 as my guide for support while the 2022’s trendline resistance of major swing highs around 4,090 is the roof to congestion.
Chart of the S&P 500 Overlaid with the 20 and 200-Day SMAs (Daily)
Chart Created on Tradingview Platform
I was dubious of the S&P 500’s ability to commit to a trend this week given the anticipation of the FOMC and other key events the week following and the uneven response to the PCE deflator and NFPs through the end of last week. The ISM service sector activity report released this past session added to the erosion of fundamental traction. Generally, the most representative (and timely) measure of the US economy unexpectedly accelerated from 54.4 to 56.6 – fending off the concerns following its factory counterpart released last week. Further, the component readings showed that business activity surged (55.7 to 64.7), employment turned positive (49.1 to 51.5) and the prices gauge was little changed (70.7 to 70.0). Overall, that can feed speculation that the Fed will pursue the higher terminal rate that Powell reiterated last Wednesday, where the market initially focused on the slower pace of hikes comment.
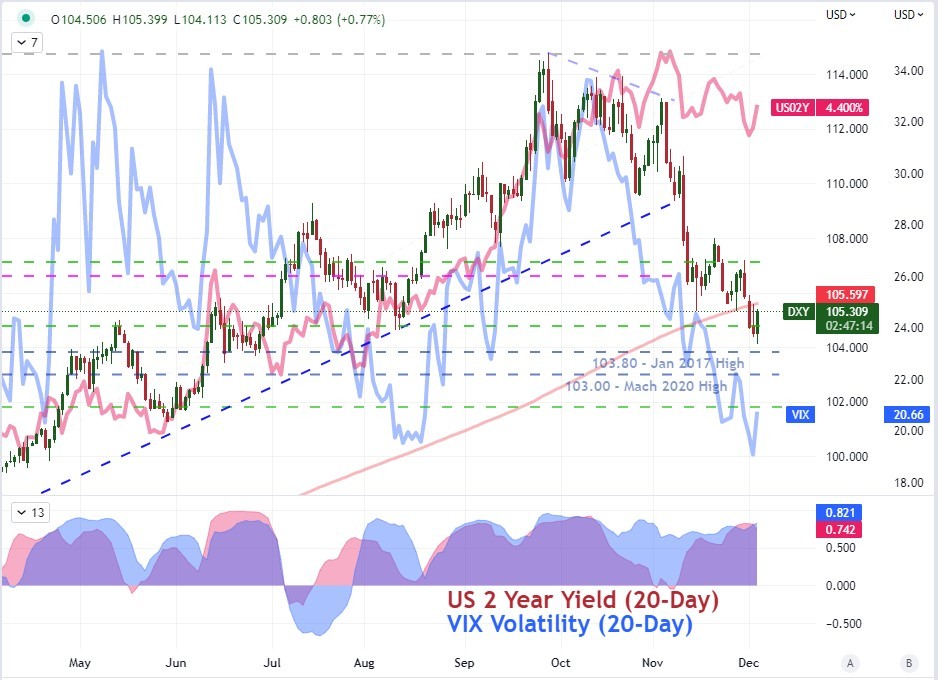
The same backdrop for speculative view likely exists for the US Dollar, but here the pricing the December and terminal rate levels is likely less sensitive. The Greenback charged to multi-decade highs despite many of its peer central banks pursuing tightening regimes of their own. Rates may still matter for the currency, but not in the format we typically suspect. Below, I have overlaid the 2-year Treasury yield (a proxy for Fed Fund rates) and the VIX volatility index (the measure of ‘fear’). Both enjoy a high correlation to the Dollar over a 20-day rolling basis, suggesting it is playing the role of a traditional carry currency. Will this be enough to restore the bulls?
Recommended by John Kicklighter
Get Your Free USD Forecast
Chart of the DXY Dollar Index with 20 and 200-Day SMAs, 20-Day Rate of Change (Daily)
Chart Created on Tradingview Platform
One consideration working against the prospect of the Dollar mounting a serious recovery trend is the lack of sizable event risk ahead. It is possible that a general bias can carry the market to a meaningful trend, but such productive movement usually requires serious conviction. There are macro events to monitor on the docket, but nothing that stands out as a capable of redefining the scale of sentiment nor the Fed’s overall monetary policy ambitious. The US trade balance and LMI Logistics Manager Index for October and November respectively can offer insight, but are unlikely to change the tone of the market. Nothing of that magnitude from the US side really shows up until Friday’s UofM Consumer Confidence survey; but by that time, we will be in the full pull of the FOMC rate decision on December 14th.
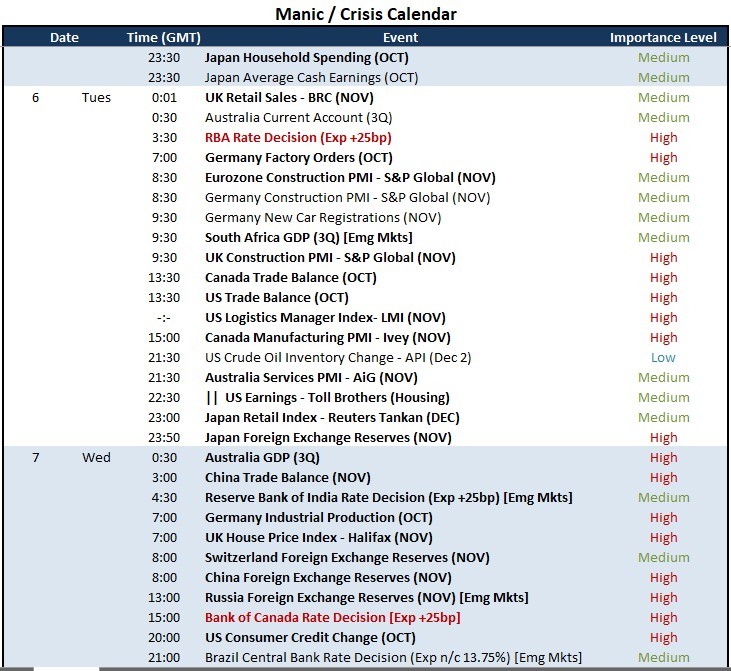
Critical Macro Event Risk on Global Economic Calendar for Next 48 Hours
Calendar Created by John Kicklighter
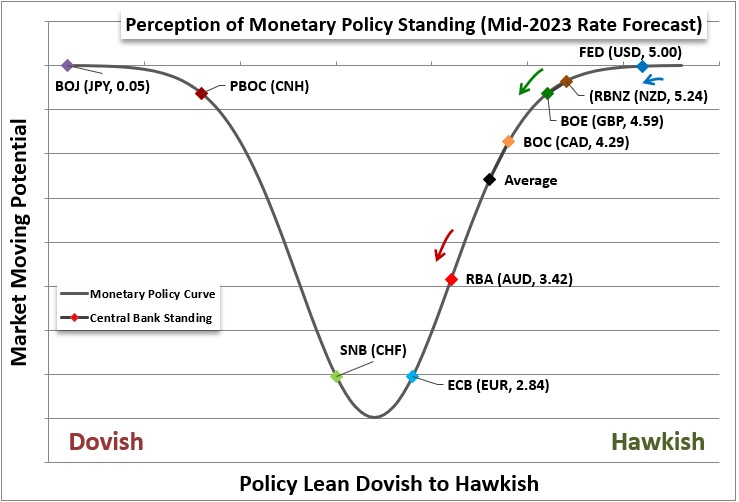
Speaking of rate decisions, we are coming into the run of major developed and emerging market central bank rate decisions scheduled for this week. Kicking off Tuesday trade, we are due the Reserve Bank of Australia’s (RBA) call on stance. The economist consensus is for a 25bp hike to a 3.10 percent benchmark. The tempo and previous statements suggests this central bank is nearing the terminal rate more quickly than counterparts like the Fed. Less than a month ago, the forecast for the RBA’s benchmark rate via futures suggested the group would lift up to a level around 3.90 percent, but the same instruments are currently pricing in a 3.42 percent level by mid-2023. The 25bp move at this meeting will likely generate little heat among Aussie traders (unless they hold or hike more aggressively), rather the focus will be on the rhetoric. If they indeed depress the breaks further, it could extend the AUDUSD correction or urge a 91 break from AUDJPY. Looking a little further ahead, it will be important to be mindful that the Bank of Canada is up on Wednesday along with the Reserve Bank of India and Brazilian Central Bank.
Graph of Relative Monetary Policy Standing of Major Central Banks
Graph Created by John Kicklighter
[ad_2]
Source link


