[ad_1]
The stock market, as measured by the S&P 500 Index
SPX,
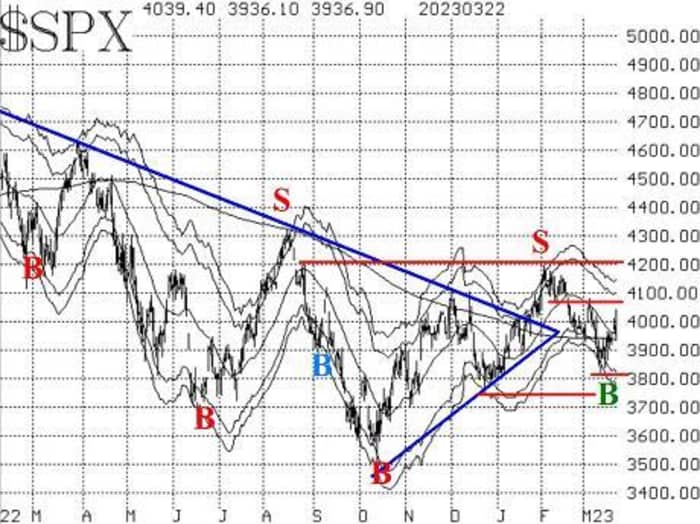
has tried to rally since March 12th, when the heavily oversold market began to bounce. This rally has generated several buy signals, but the fact remains that the chart of SPX is still negative — lower highs and lower lows.
It seems that every time the bulls think they can celebrate, the Fed or the Treasury throws cold water on the party by pointing out something negative about rates or about not saving every bank in the country if it goes under.
So, at this point, there is resistance on the SPX chart at 4040 (Wednesday’s highs), but there is stronger resistance in the entire area between 4080 and 4200 — the trading range from the first half of February. As for support, the general area between 3760 and 3850 remains in place. The recent March 12th lows were in that range.
The recent rally is, so far, merely an oversold rally. Such rallies typically reach the declining 20-day Moving Average of SPX — or perhaps exceed it by a small amount — and then fall back again. That scenario is in place regarding the current rally.

A new McMillan Volatility Band (MVB) buy signal was confirmed on March 16th. That signal has a target of the +4σ “modified Bollinger Band” (mBB), which is at 4140, but would begin to rise if SPX were to approach that price. The MVB buy signal would be stopped out if SPX closes below the -4σ Band, which is currently at 3800 but declining.
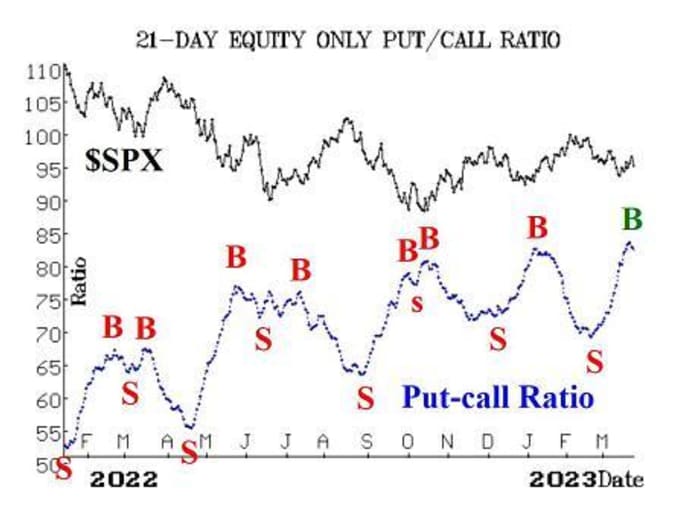
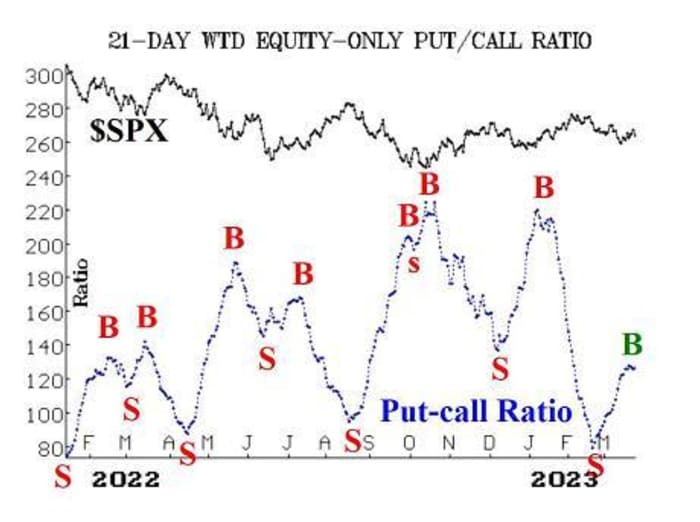
Equity-only put-call ratios were rising quite rapidly, despite the recent rally in stocks. However, as of just a day or two ago, there were new buy signals from both the standard and weighted equity-only put-call ratios. These signals are confirmed by the computer programs that we use to analyze these charts. Both signals are marked with green “B’s” on the accompanying put-call ratio charts. These new buy signals would be canceled out if the ratios moved above the highs of this week.


The total put-call ratio has also reached oversold territory and is attempting to roll over and form a peak, which would be a buy signal. So far, this ratio has not been able to generate a confirmed buy signal.
Market breadth has heavily negative since early February. As a result, both breadth oscillators have been on sell signals for some time. They, too, reached extremely oversold territory a week or so ago. This week, with the strong rallies on Monday and Tuesday, breadth improved. But it was still not enough to generate buy signals, and now the negative breadth following the FOMC meeting on Wednesday has pushed the oscillators lower — keeping them on sell signals still.
New 52-week Lows on the NYSE have continued to dominate New 52-week Highs. Thus, this indicator remains on the sell signal that was generated a week or so ago. This is the only recent new sell signal.
VIX
VIX,
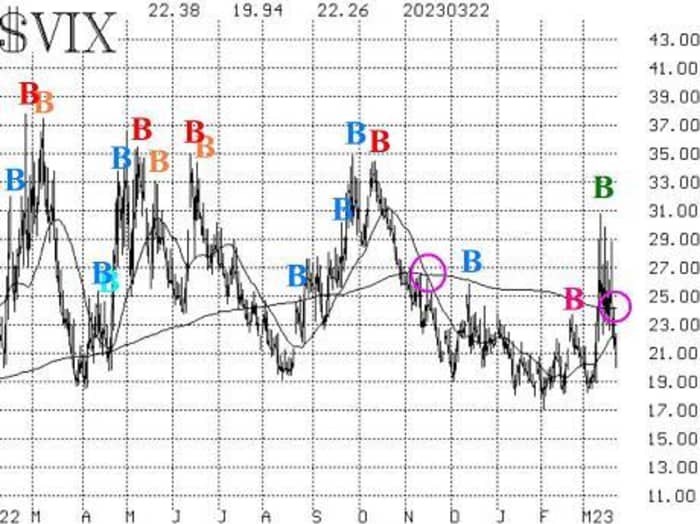
has produced some buy signals as well. First, the “spike peak” buy signal of just over a week ago remains in place. Second, with VIX closing below its 200-day Moving Average, a new trend of VIX buy signal has been generated as well. It is marked with a circle on the accompanying VIX chart; the previous one from last November is marked as well. This trend of VIX buy signal is generally an intermediate-term signal. It will remains in place until either VIX or its 20-day Moving Average crosses back above the 200-day MA.

There was some worry during the mini-financial crisis that the term structure of the volatility derivatives might invert. That would be a big negative for stocks, but it did not occur. The term structures are sloping modestly upward now. The April VIX futures are now the front month, so we are comparing their price that of the May VIX futures. If April rises above May, that is a negative for stocks.
In summary, we are maintaining our “core” bearish position because of the negative chart for SPX. We have now seen a number of buy signals occur: MVB, equity-only put-call ratios, VIX “spike peak”, and the trend of VIX. Breadth and “New Highs vs. New Lows” remain on sell signals. Thus, the picture is mixed. In the past, there have been many times when the indicators seemed to turn bullish after massive oversold conditions were worked off, but the chart of SPX was not in agreement. This is another one of those, and the chart of SPX wins every time – by definition. So, we will continue to trade this other signals around our “core” bearish position.
New Recommendation: MVB buy signal
We want to take a position in line with the recent MVB buy signal:
Buy 1 SPY
SPY,
Apr (28th) at-the-money call
And Sell 1 SPY Apr (28th) call with a striking price 15 points higher.
This position would be stopped out if SPX were to close below the -4σ Band. We will keep you up to date on that information weekly.
New Recommendation: Equity-only put-call ratio buy signal
As noted in the market commentary section above, there have been new buy signals by the put-call ratios, so we want to add position based on that.
Buy 1 SPY May (19th) at-the-money call
And Sell 1 May (19th) call with a striking 20 points higher.
This buy signal would be stopped out if the ratios moved above their recent peaks. Again, that is something that we will update weekly.
Follow-Up Action:
We are using a “standard” rolling procedure for our SPY spreads: in any vertical bull or bear spread, if the underlying hits the short strike, then roll the entire spread. That would be roll up in the case of a call bull spread, or roll down in the case of a bear put spread. Stay in the same expiration, and keep the distance between the strikes the same unless otherwise instructed.
Long 2 GRMN April (21st) 95 puts: These were bought on February 21st, when GRMN
GRMN,
closed below 95. We will remain in this position as long as the GRMN weighted put-call ratio remains on a sell signal.
Long 2 SPY April (21st) 390 and short 2 SPY April (21st) 360 puts: this is our “core” bearish position. Close out this position if SPX closes above 4080.
Long 10 LLAP Apr (21st) 2 calls: Stop out if LLAP
LLAP,
closes below 1.90.
Long 2 OMC Apr (21st) 85 puts: Hold these puts as long as the weighted put-call ratio for OMC
OMC,
remains on a sell signal.
Long 1 SPY May (19th) 391 put and Short 1 SPY May (19th) 351 put: This spread was bought in line with the sell signals from the “New Highs vs. New Lows” indicator. This sell signal would be stopped out if New Highs on the NYSE outnumber New Lows for two consecutive days.
Long 1 SPY Apr (21st) 391 call and Short 1 SPY Apr (21st) 411 call: This call bull-spread was bought in line with the VIX “spike peak” buy signal. We are going to tighten the stop: stop yourself out if VIX returns to “spiking” mode – that is, if it rises by at least 3.00 points over any 1-, 2-, or 3-day period. Currently, that would make the closing stop at 24.38, based on the VIX close of 21.38 on March 21st.
All stops are mental closing stops unless otherwise noted.
Send questions to: lmcmillan@optionstrategist.com.
Lawrence G. McMillan is president of McMillan Analysis, a registered investment and commodity trading advisor. McMillan may hold positions in securities recommended in this report, both personally and in client accounts. He is an experienced trader and money manager and is the author of the best-selling book, Options as a Strategic Investment. www.optionstrategist.com
©McMillan Analysis Corporation is registered with the SEC as an investment advisor and with the CFTC as a commodity trading advisor. The information in this newsletter has been carefully compiled from sources believed to be reliable, but accuracy and completeness are not guaranteed. The officers or directors of McMillan Analysis Corporation, or accounts managed by such persons may have positions in the securities recommended in the advisory.
[ad_2]
Source link
