
[ad_1]
Gold, Silver, US Dollar, FOMC, CPI, ETF Flows, COT, Technical Outlook – Talking Points
- Gold and silver prices approach key technical levels as fundamentals improve
- The US CPI inflation report on Thursday poses a risk to the precious metal rally
- XAU/USD eyes a Triple Bottom breakout, while XAG/USD probes its 200-day SMA
Trade Smarter – Sign up for the DailyFX Newsletter
Receive timely and compelling market commentary from the DailyFX team
Subscribe to Newsletter
Gold and silver prices are moderating in Asia-Pacific trading after the precious metals surged higher on Tuesday as stock indexes rose and the US Dollar fell. That move put gold prices above 1,700 at their highest level since early October. Silver is just below 21.5 at levels not traded since June.
The US Dollar DXY Index is down nearly 2% for November, extending last month’s 0.53% decline. Precious metals have capitalized on the USD’s weakness, which makes non-USD-denominated purchases cheaper. The chart below highlights the correlation between gold and the USD. Market-based rate hike bets for the Federal Reserve’s December meeting show only a 30% chance that the FOMC will hike by 75 basis points, pointing to a slower pace of tightening.
That has made Treasuries more attractive and reduced the US yield premium against its peers. However, calling a trend reversal in yields and the Greenback is potentially premature. The October US consumer price index (CPI) will cross the wires on Thursday. Analysts expect core inflation—a measure that removes food and energy prices—to fall to 6.5% from a year ago.
That would be down from 6.6% in September. A hotter-than-expected print poses a downside risk to bullion prices, as it would likely elicit aggressive repricing in FOMC bets. Gold and silver bulls will monitor the inflation numbers and how the market reacts. Federal Reserve Bank of Cleveland President Loretta Mester and Kansas City Fed President Esther George—both FOMC voters—are due to speak on Thursday after the CPI data, which may clarify any uncertain market reaction.
Gold Versus US Dollar – Daily Chart
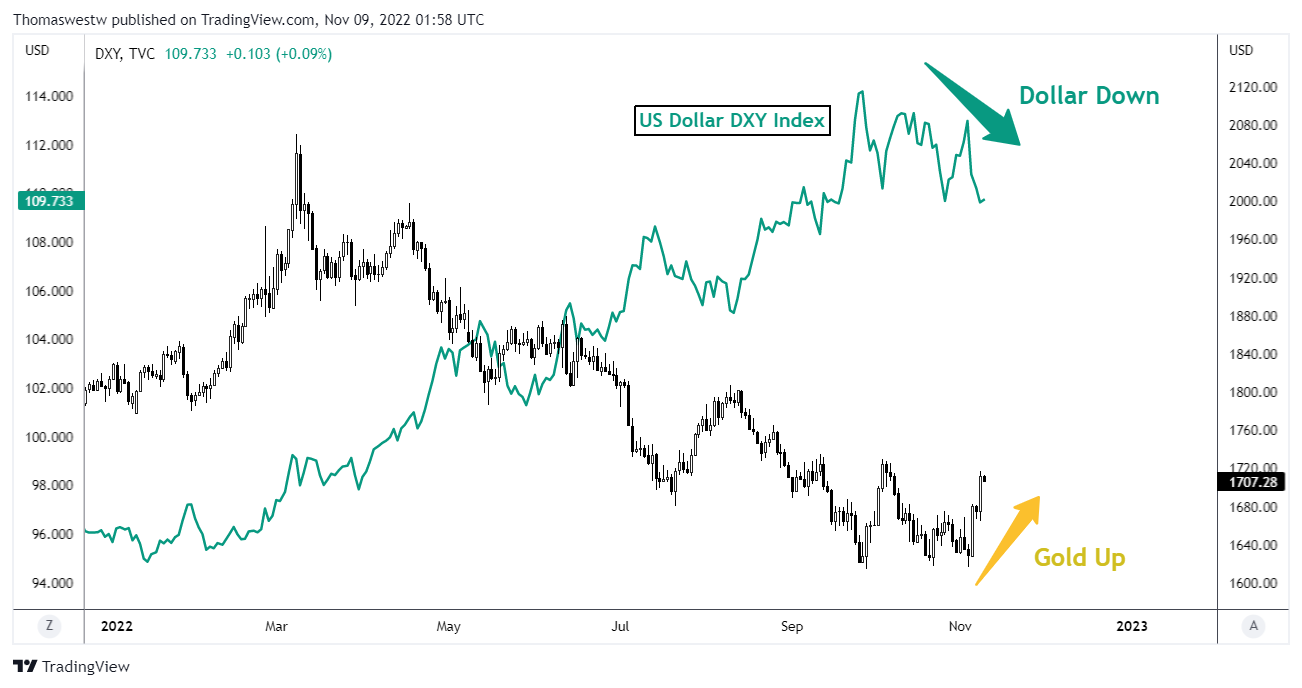
Chart created with TradingView
Trader Positioning – COT
The latest Commitments of Traders report (COT) from the CFTC for the week ending November 01 showed a 1.7k reduction to gold’s net long position after speculators added 6.7k longs and 8.5k shorts. The recent price surge likely forced some of those shorts to cover their positions, which fuels further upside on short covering.
Gold Versus Non-Commercial Longs/Shorts – Daily Chart
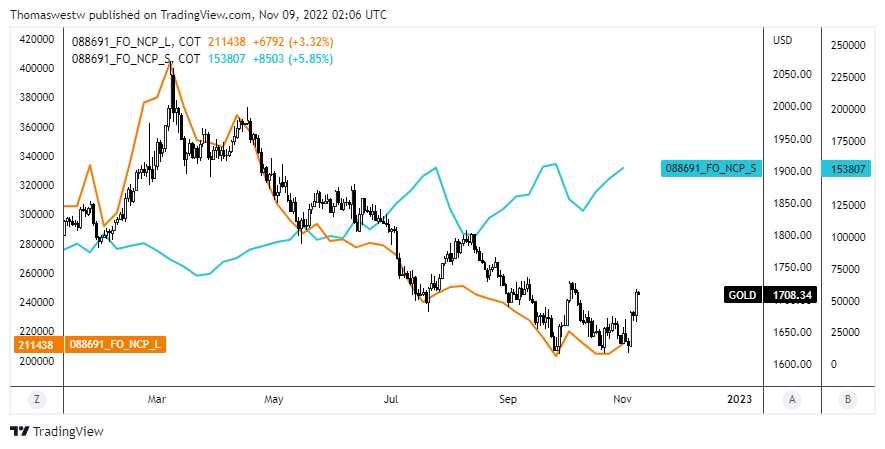
Chart created with TradingView
Silver positioning among speculators rose 1.8k for the same period, per the COT data. However, short positioning remained robust at 49k. Silver’s +2% performance this week is likely also due partly to short covering. An updated COT report is due on Friday.
Silver Versus Non-Commercial Longs/Shorts – Daily Chart
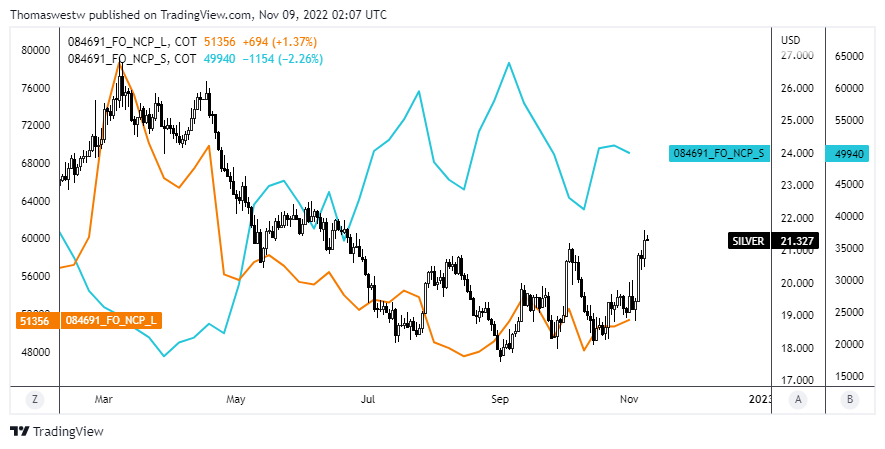
Chart created with TradingView
Recommended by Thomas Westwater
How to Trade Gold
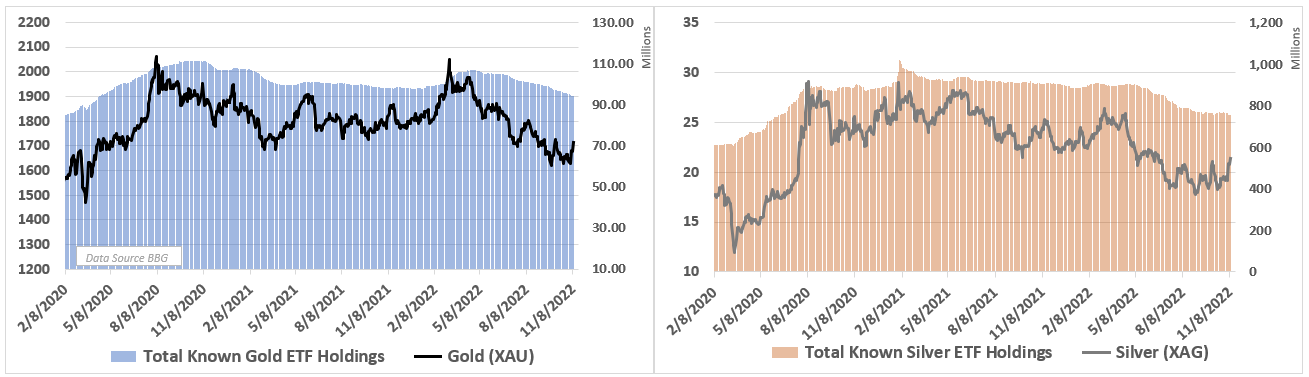
Gold and Silver ETF Holdings Review
Despite gold and silver up around 4.5% and 11.6% this month, outflows from exchange-traded funds (ETFs) for the metals have persisted. Month-to-date, gold’s total known ETF holdings are down 0.78%, while silver’s total known ETF holdings have dropped by 1.06% for the same period.
If prices continue to rise, these outflows should slow or even reverse. Generally, ETF flows lag reactions in the underlying, so it doesn’t constitute a bearish sign yet. If those outflows continue as prices rise, further investigation would be needed. However, outflows have eased from September when gold ETF holdings dropped by 1.99% and silver by 0.10%.
Gold Technical Outlook
A Triple Bottom pattern puts a potential trend reversal on the cards. Gold bottomed around 1,617 three times from September to November. After piercing above the 50-day Simple Moving Average (SMA), prices are approaching the pattern’s resistance level defined by the peak between the first two lows. A break above resistance is required to complete the pattern, with a measured move target at 1,845.
Gold Daily Chart
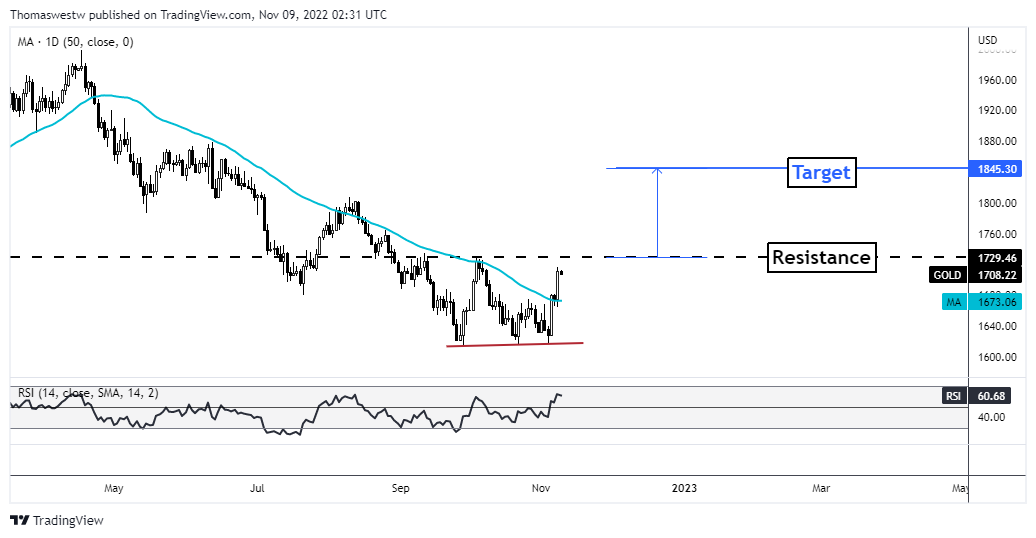
Chart created with TradingView
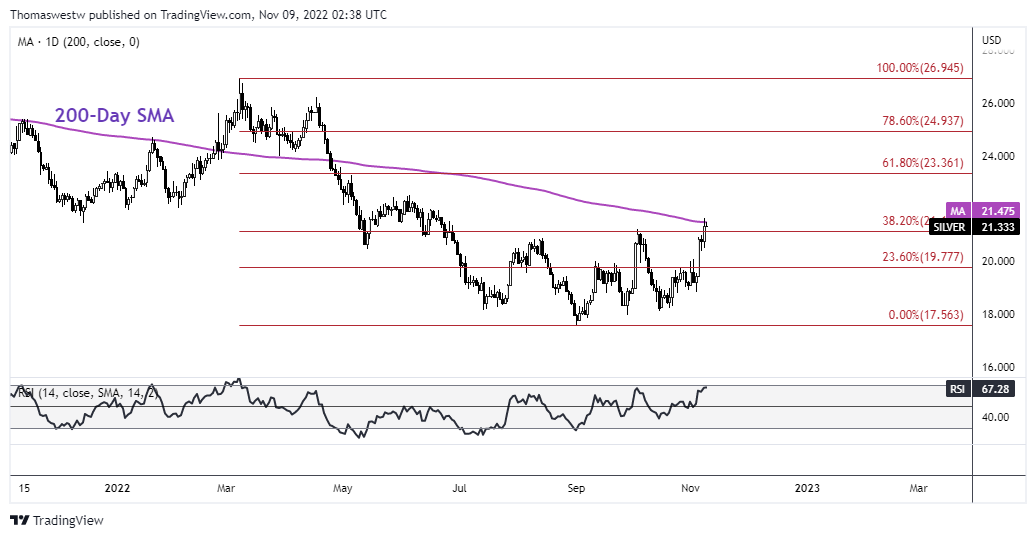
Silver Technical Outlook
Silver is at the high-profile 200-day SMA after dispatching the 38.2% Fibonacci retracement from the March/September major move. That Fib level stopped prices in October but may act as support on a pullback. A break above the SMA would likely induce further strength, potentially allowing prices to challenge the June swing high at 22.51.
Silver Daily Chart
Chart created with TradingView
Foundational Trading Knowledge
Commodities Trading
Recommended by Thomas Westwater
— Written by Thomas Westwater, Analyst for DailyFX.com
To contact Thomas, use the comments section below or @FxWestwater on Twitter
[ad_2]
Source link