
[ad_1]
Gold, Silver, Retail Trader Positioning, Technical Analysis – IGCS Commodities Update
- Gold and silver prices have been rising in recent days
- Retail traders are back to boosting downside exposure
- Is this a hint that XAU/USD and XAG/USD may rise?
Recommended by Daniel Dubrovsky
Get Your Free Gold Forecast
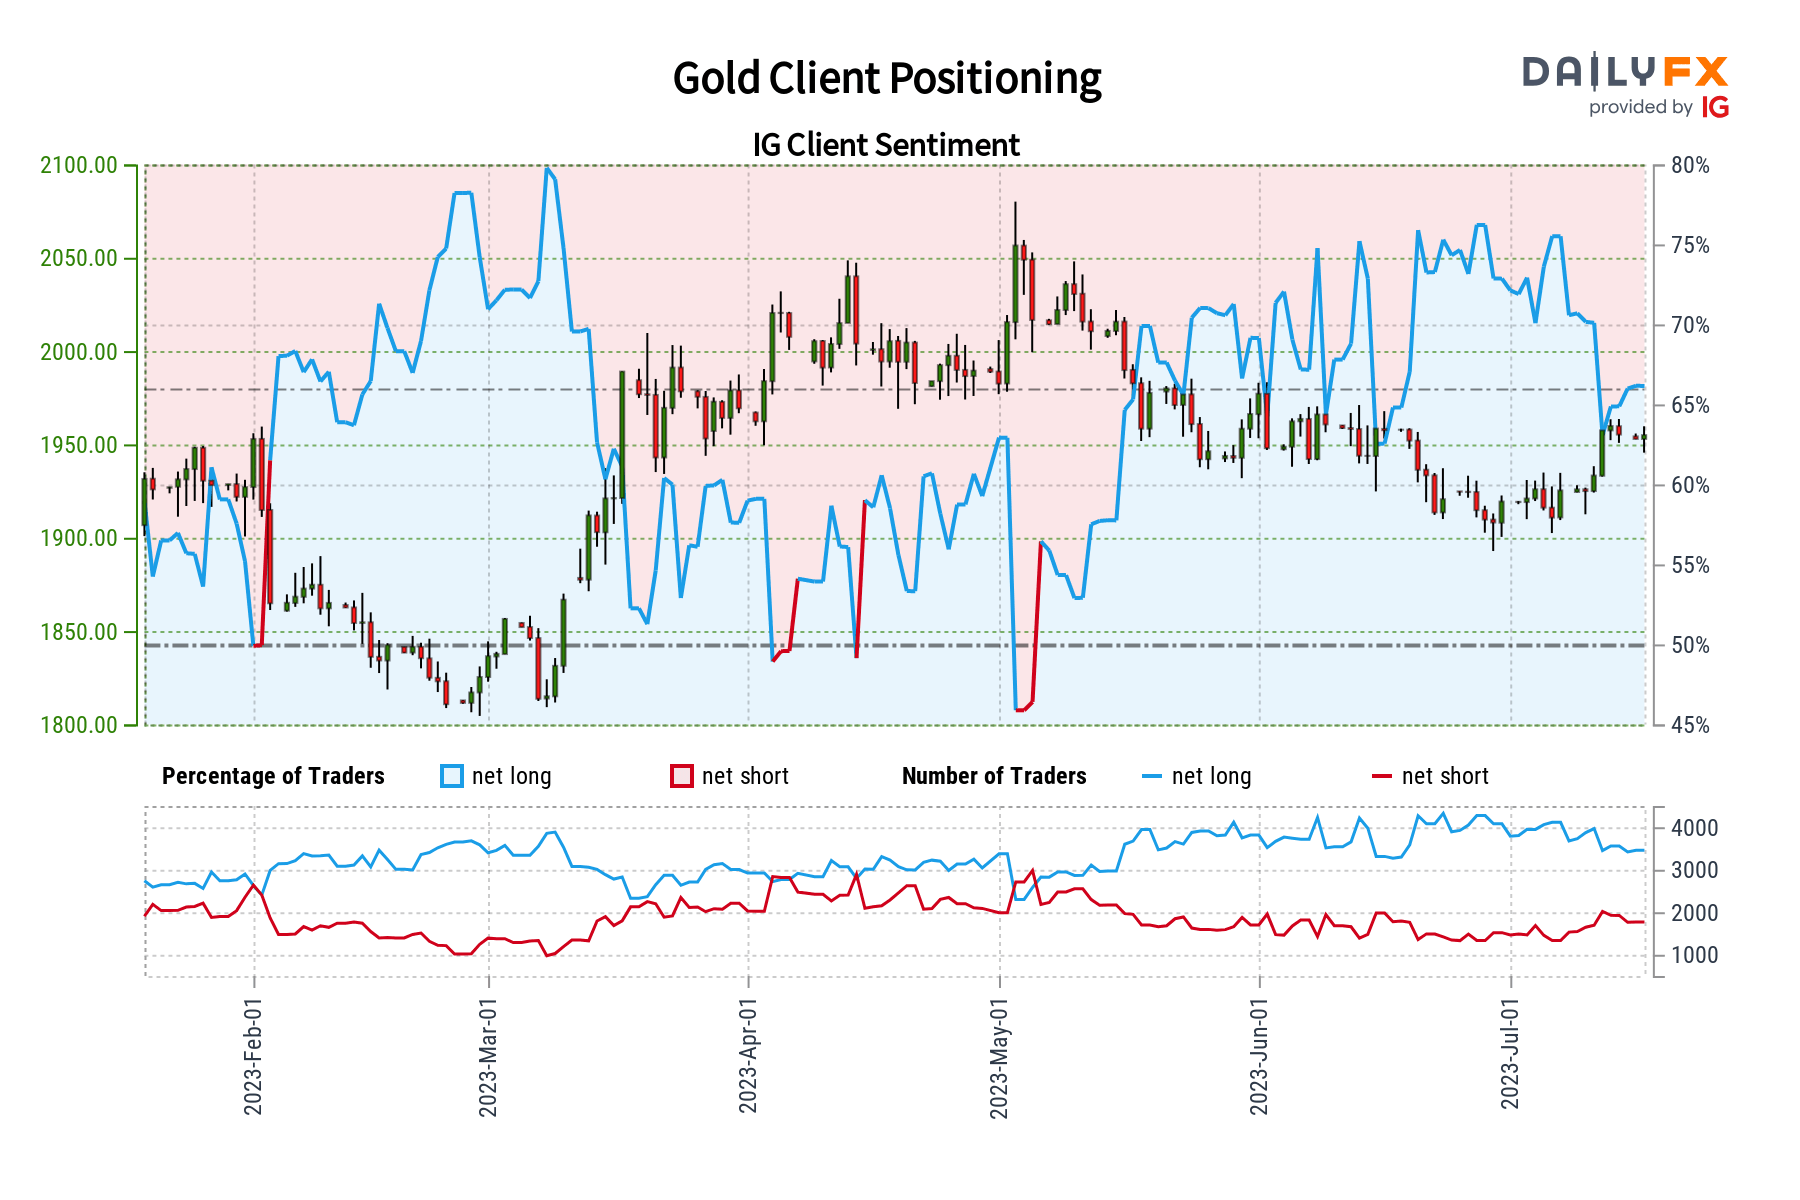
In recent days, gold and silver prices have been pushing higher, moves that were in response to a cautious weakening in US Treasury yields as well as the US Dollar. In reaction, retail traders have increased their downside exposure in these precious metals. This can be seen by looking at IG Client Sentiment (IGCS), which functions as a contrarian indicator. With that in mind, is this a sign that further gains might be ahead for XAU/USD and XAG/USD?
Gold Sentiment Outlook – Bullish
The IGCS gauge shows that about 66% of retail traders are net-long gold. Since most of them are biased to the upside, this hints that prices may continue falling down the road. That said, downside exposure has increased by 6.29% and 14.69% compared to yesterday and last week, respectively. With that in mind, recent changes in exposure hint that prices may reverse higher despite overall positioning.
XAU/USD Daily Chart
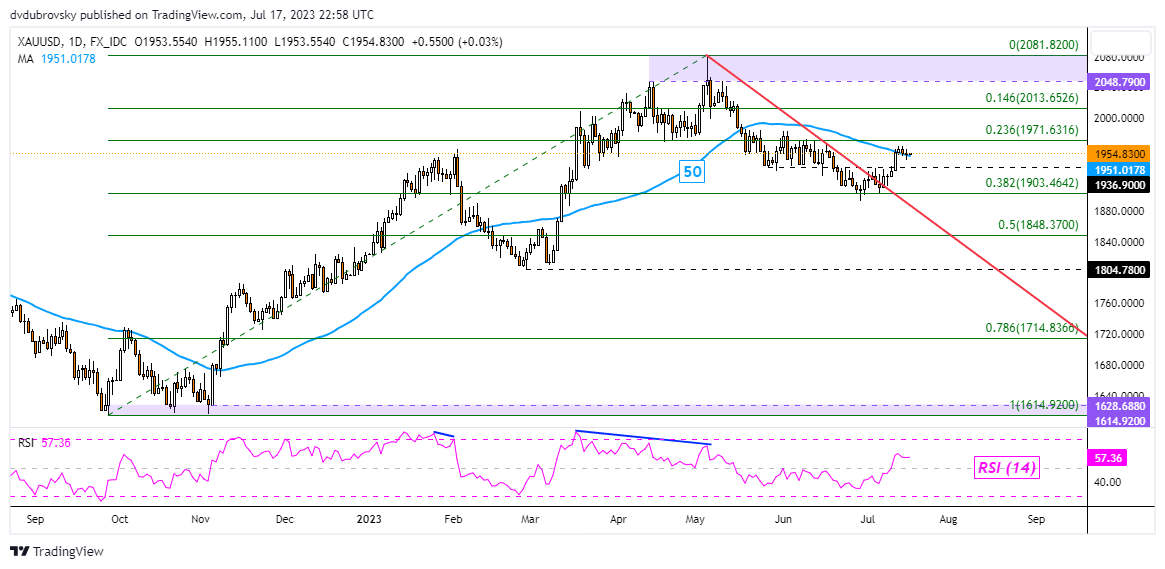
On the daily chart, gold has confirmed a breakout above a near-term falling trendline from May. That has opened the door to resuming the broader uptrend since November. Still, prices were unable to clear the 50-day Simple Moving Average (SMA), which is holding as resistance. Confirming a push above this point may further validate a near-term bullish technical bias. That places the focus on the 23.6% Fibonacci retracement level at 1971.
Recommended by Daniel Dubrovsky
How to Trade Gold
Silver Sentiment Outlook – Bullish
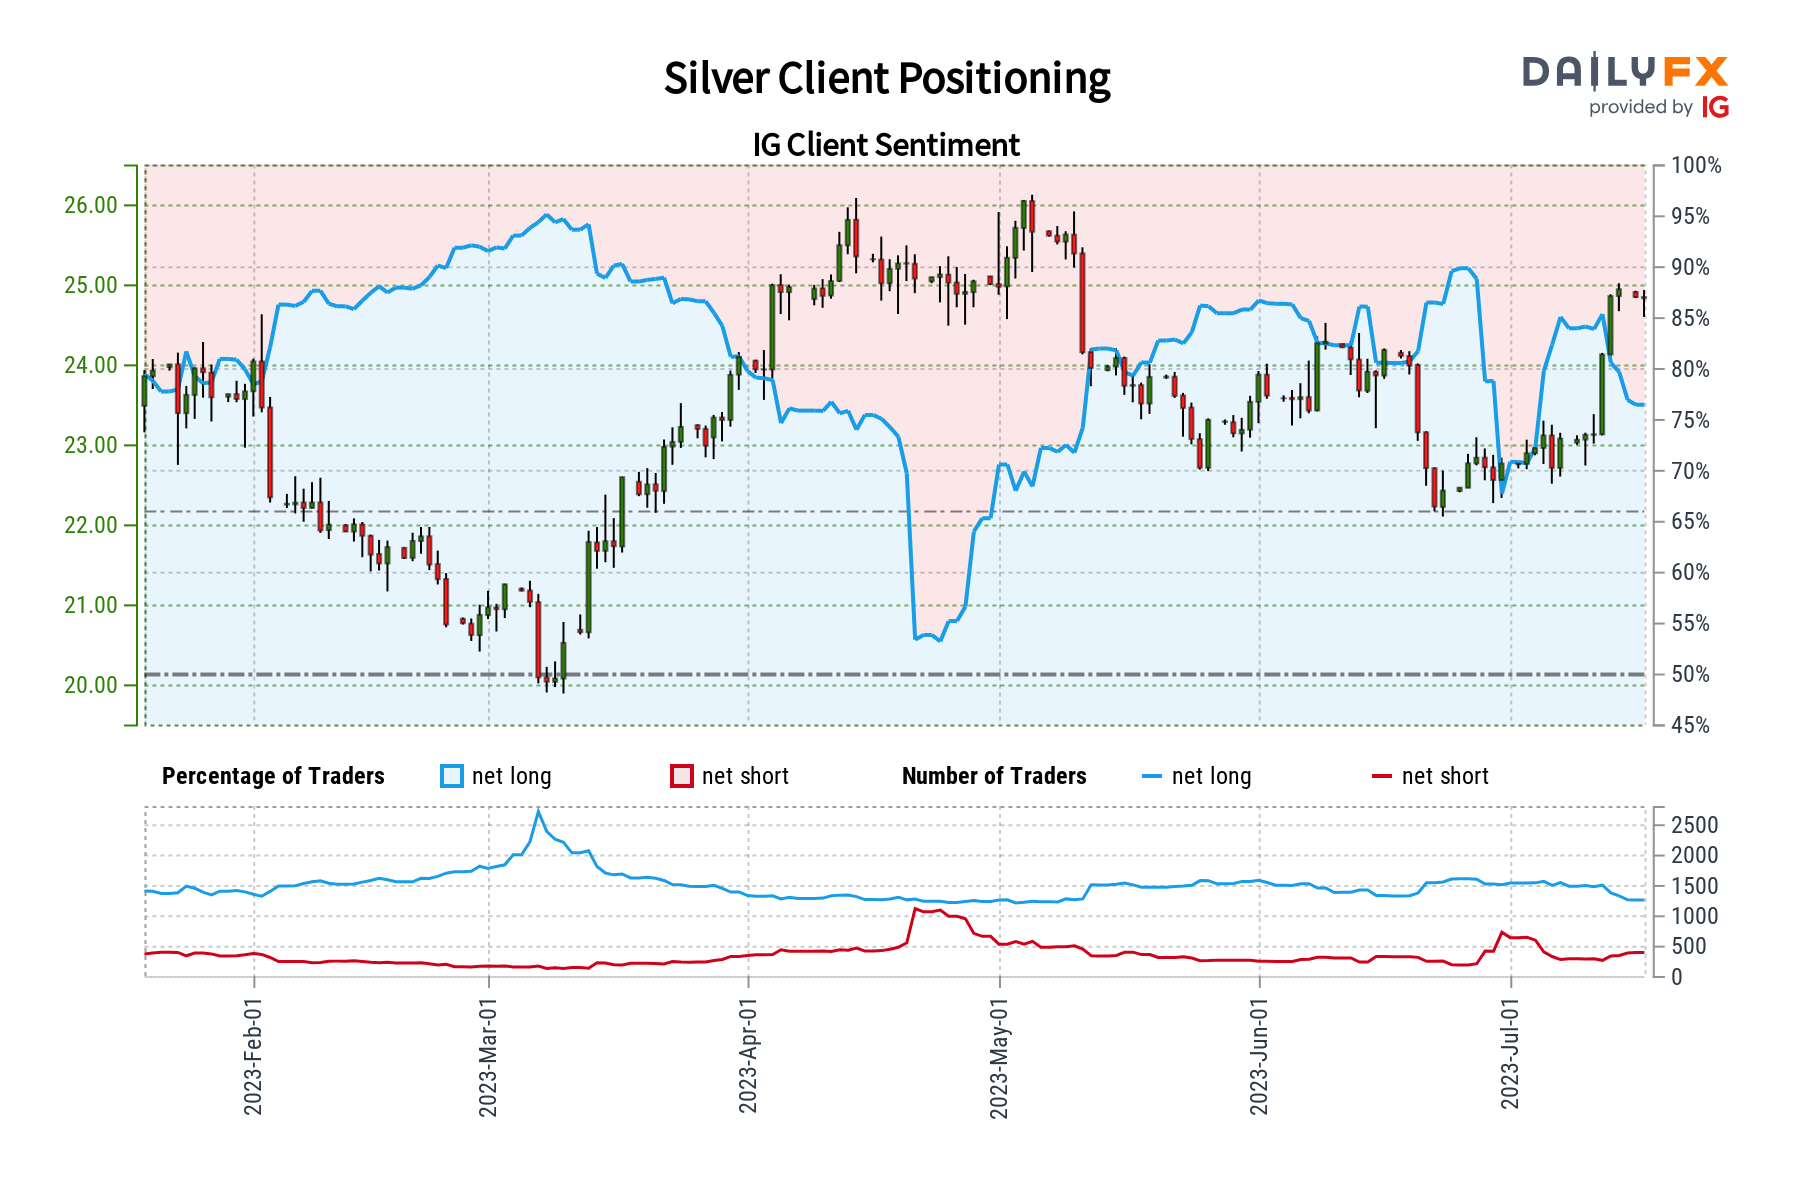
The IGCS gauge displays that roughly 76% of retail traders are net-long silver. Since most of them are biased higher, this offers a hint that prices may continue falling down the road. That said, downside bets have increased by 1.54% and 41.07% compared to yesterday and last week, respectively. With that in mind, these recent changes offer a hint that the price trend may soon reverse higher.
Discover what kind of forex trader you are

XAG/USD Daily Chart
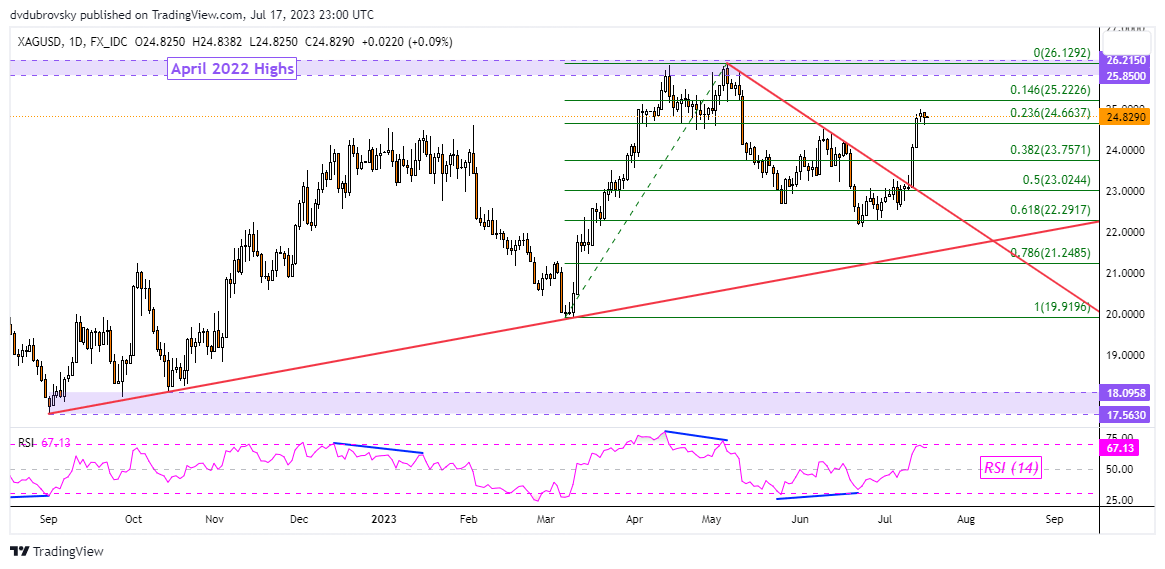
Silver confirmed a breakout above the near-term falling trendline from May as well as the 23.6% Fibonacci retracement level at 24.66. Key resistance is the 14.6% minor level at 25.22. Further pushing beyond this price exposes highs from April 2022, making for a zone between 25.85 and 26.21. This is where XAG/USD got stuck in April and turned lower.
— Written by Daniel Dubrovsky, Senior Strategist for DailyFX.com
[ad_2]
Source link