
[ad_1]
Gold Price Outlook:
- Gold prices are making strides as US real yields fall back.
- However, unless gold prices break the downtrend from the March and August swing highs, it’s too soon to call a short-term bottom.
- Gold prices have a bullish bias in the near-term, according to the IG Client Sentiment Index.
Recommended by Christopher Vecchio, CFA
Get Your Free Gold Forecast
US Dollar Fuels Rebound
The sharp pullback by the US Dollar (via the DXY Index) at the end of last week has helped gold prices regain their footing as the calendar turns towards the middle of November. Gold prices were able to rally +2.22% last week, in turn warding off a potential breakdown to fresh yearly lows in the wake of the November Fed meeting. What was a double bottom may now be a triple bottom, suggesting that the lows may have been found.
Nevertheless, there is still wood to chop, as they say. Fundamentally, the decline by the US Dollar tracked a drop in December Fed rate hike odds, even though a 50-bps rate hike is still discounted. More importantly, US real yields have not fallen back, with the US 10-year real yield sitting at 1.717% today – not far off from its yearly high of 1.815% set in mid-October. Thus, while a technical turnaround appears to be gaining validity again, there are still reasons to have some doubt about the ability of old prices to sustain a meaningful rally.
Gold Volatility Steady as Gold Prices Rebound
Historically, gold prices have a relationship with volatility unlike other asset classes. While other asset classes like bonds and stocks don’t like increased volatility – signaling greater uncertainty around cash flows, dividends, coupon payments, etc. – gold tends to benefit during periods of higher volatility. Gold volatility has proved stable, and the US Dollar has stepped backwards, gold prices have been given some breathing room.
GVZ (Gold Volatility) Technical Analysis: Daily Price Chart (November 2021 to November 2022) (Chart 1)

Gold volatility (as measured by the Cboe’s gold volatility ETF, GVZ, which tracks the 1-month implied volatility of gold as derived from the GLD option chain) was trading at 18.31 at the time this report was written. The 5-day correlation between GVZ and gold prices is +0.02 while the 20-day correlation is +0.34. One week ago, on October 31, the 5-day correlation was +0.52 and the 20-day correlation was +0.38.
Gold Price Rate Technical Analysis: Daily Chart (November 2021 to November 2022) (Chart 2)

A triple bottom may be formed against 1614/17, reinforced by multiple morning star candlestick patterns since the end of September. But the descending trendline from the March and October highs remains as resistance, and until the downtrend breaks, it’s too soon to call a turn. Patience remains the name of the game, but it still golds that “a move above the area around 1680…would see gold prices trade back above former multi-month support (turned resistance) and break the downtrend in place” from the March and October highs.
Gold Price Technical Analysis: Weekly Chart (October 2015 to November 2022) (Chart 3)

Should gold prices break the downtrend from the March and October highs, hurdling 1680 – as well as the 38.2% Fibonacci retracement of the 2015 low/2020 high range at 1682.27 – would warrant a more bullish outlook moving forward. Until then, a “sudden shift in the environment suggests that the daily timeframe (and lower, like the 4-hour timeframe) will be better suited to pay attention to over the coming days/weeks as it will take a long time for technical indicators to evolve on the weekly timeframe.”
Recommended by Christopher Vecchio, CFA
Building Confidence in Trading
IG CLIENT SENTIMENT INDEX: GOLD PRICE FORECAST (November 7, 2022) (Chart 4)
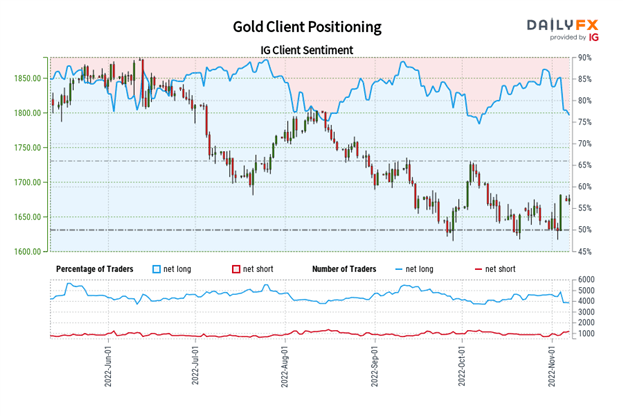
Gold: Retail trader data shows 75.34% of traders are net-long with the ratio of traders long to short at 3.05 to 1. The number of traders net-long is 6.16% higher than yesterday and 9.51% lower from last week, while the number of traders net-short is 21.11% higher than yesterday and 33.17% higher from last week.
We typically take a contrarian view to crowd sentiment, and the fact traders are net-long suggests Gold prices may continue to fall.
Yet traders are less net-long than yesterday and compared with last week. Recent changes in sentiment warn that the current Gold price trend may soon reverse higher despite the fact traders remain net-long.
Trade Smarter – Sign up for the DailyFX Newsletter
Receive timely and compelling market commentary from the DailyFX team
Subscribe to Newsletter
— Written by Christopher Vecchio, CFA, Senior Strategist
[ad_2]
Source link