[ad_1]
Gold Price Outlook:
- Gold prices have dropped below the November 2020 and January 2021 highs once more, which served as resistance at the end of February and throughout March.
- Rising US real rates have historically been a headwind for gold prices, and the 10-year real rate is on the cusp of turning positive for the first time since the pandemic began.
- According to the IG Client Sentiment Index, gold prices hold a bearish bias in the near-term.
A Fundamental Headwind Arrives
Gold prices have given up all of their gains over the past week, after briefly flirting with a move back above 2000 yesterday. The drop in gold prices now sees the yellow metal trading back below a confluence of former highs carved out between November 2020 and January 2021, which consequently served as resistance as recently as late-February and mid-March.
The catalyst has little to do with recent inflation figures or the Russian invasion of Ukraine, however. Instead, it’s the arrival of positive real interest rates in the US. For the first time since the pandemic began, the US 10-year real yield is about to turn positive. Historically speaking, as discussed in the 2Q’22 quarterly gold forecast, rising real yields have a negative correlation with gold prices. Further advances by US real yields will only make the environment more difficult for gold prices, particularly if the geopolitical risk premium embedded in price dissipates if the Russian invasion of Ukraine begins to wind down.
Gold Volatility Drops, Weighs on Gold Prices
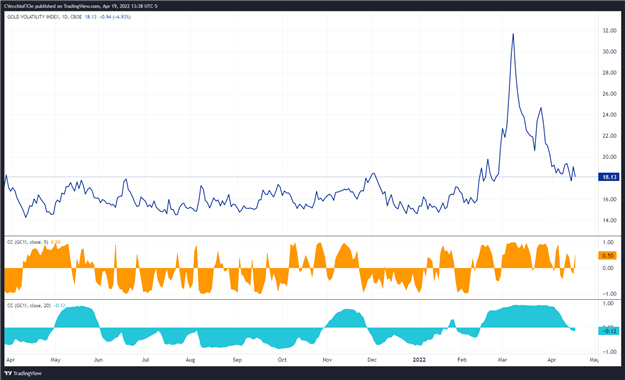
Historically, gold prices have a relationship with volatility unlike other asset classes. While other asset classes like bonds and stocks don’t like increased volatility – signaling greater uncertainty around cash flows, dividends, coupon payments, etc. – gold tends to benefit during periods of higher volatility. The continued erosion in gold volatility throughout April has undercut gold prices’ ability to sustain a significant rally, a further drop will make any forthcoming upside attempts feckless.
GVZ (Gold Volatility) Technical Analysis: Daily Price Chart (April 2021 to April 2022) (Chart 1)
Gold volatility (as measured by the Cboe’s gold volatility ETF, GVZ, which tracks the 1-month implied volatility of gold as derived from the GLD option chain) was trading at 18.13 at the time this report was written. The 5-day correlation between GVZ and gold prices is +0.50 while the 20-day correlation is -0.12. One week ago, on April 12, the 5-day correlation was +0.55 and the 20-day correlation was +0.10.
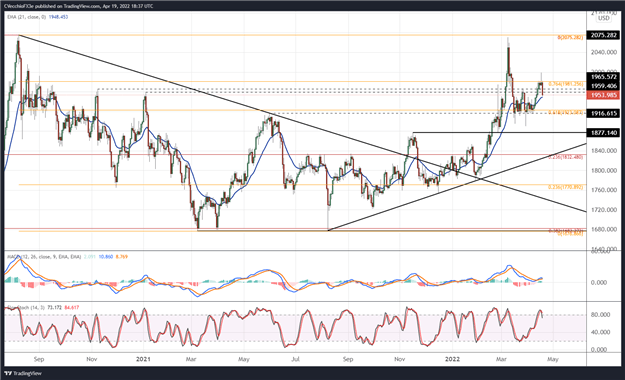
Gold Price Rate Technical Analysis: Daily Chart (June 2020 to April 2022) (Chart 2)
Gold prices have dropped below their mid-March high, and in doing so, find themselves back below the confluence of resistance carved out at the November 2020 and January 2021 highs between 1959.41 and 1965.57. The drop has wiped out all gains over the past week, and further losses from here could see a bearish weekly outside engulfing bar form, signaling a near-term top.
Momentum is starting to turn bearish. Gold prices are below their daily 5-, 8-, and 13-EMAs, but still above its daily 21-EMA; the daily EMA envelope is in neither bearish nor bullish sequential order. Daily MACD is on the cusp of issuing a sell signal (albeit above its signal line), while daily Slow Stochastics have dropped out of overbought territory. A move below the daily 21-EMA would offer strong confirmation that a ‘lower high’ has been established after failing to hurdle 2000.
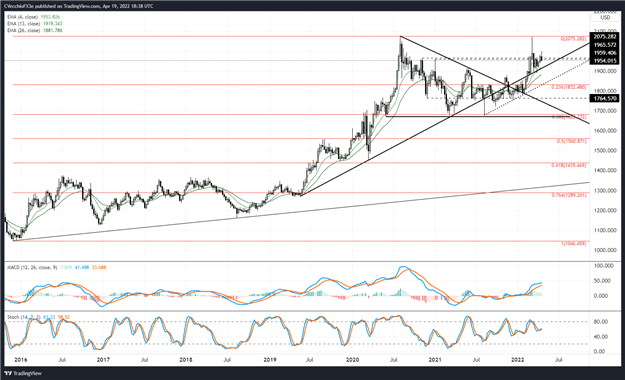
Gold Price Technical Analysis: Weekly Chart (October 2015 to April 2022) (Chart 3)
The weekly timeframe still showcases the potential for a clear double top in gold prices, formed by the August 2020 and March 2022 highs. As previously noted, “falling below the highs from November 2020 and January 2021 around 1959/1965 hint that a false bullish break higher has transpired,” which remains valid. A move below last week’s low of 1940.04 would cement a bearish outside engulfing bar on the weekly timeframe, suggesting at imminent downside potential.
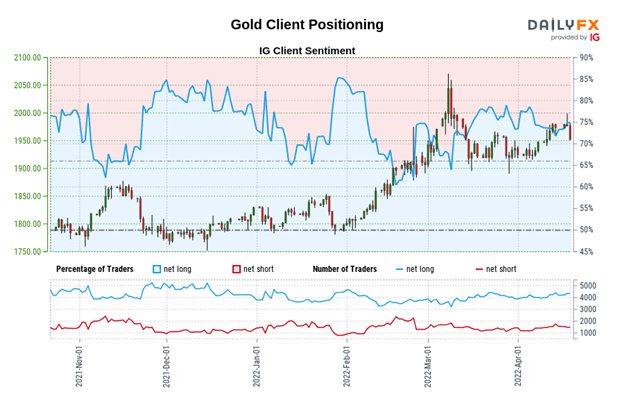
IG CLIENT SENTIMENT INDEX: GOLD PRICE FORECAST (April 9, 2022) (Chart 4)
Gold: Retail trader data shows 76.43% of traders are net-long with the ratio of traders long to short at 3.24 to 1. The number of traders net-long is 0.30% lower than yesterday and 4.08% higher from last week, while the number of traders net-short is 17.46% lower than yesterday and 15.64% lower from last week.
We typically take a contrarian view to crowd sentiment, and the fact traders are net-long suggests Gold prices may continue to fall.
Traders are further net-long than yesterday and last week, and the combination of current sentiment and recent changes gives us a stronger Gold-bearish contrarian trading bias.
— Written by Christopher Vecchio, CFA, Senior Strategist
[ad_2]
Source link


