
Gold Price Outlook:
- Gold prices got knocked lower in the wake of the September Fed meeting as the FOMC signaled additional rate hikes over the coming months.
- Technical analysis studies suggest more weakness may be ahead for gold prices, which haven’t been able to stage a meaningful recovery above 1680.
- Gold prices retain a bearish bias in the near-term, according to the IG Client Sentiment Index.
Recommended by Christopher Vecchio, CFA
Get Your Free Gold Forecast
Fed Not Pivoting Soon
The September Fed meeting revealed a more hawkish FOMC than what markets were expecting. Ahead of the meeting, rates markets were expecting the Fed funds rate to peak at 4.5% in 2023 and end the year closer to 4%. Instead, the Summary of Economic Projections revealed that some Fed policymakers favored bringing the main rate closer to 5% at its peak, while the consensus was that the main rate would end 2023 at 4.6%.
The net-impact has been higher US Treasury yields and US real yields, which have been the bane of gold prices over the past few months (the US 10-year real yield peaked at +110-bps). It stands to reason that the fundamental environment has become more difficult over the past 24-hours, which complements the already-weak technical backdrop (never mind a bearish September seasonality tendency).
Gold Volatility Drops, Gold Prices Steady
Historically, gold prices have a relationship with volatility unlike other asset classes. While other asset classes like bonds and stocks don’t like increased volatility – signaling greater uncertainty around cash flows, dividends, coupon payments, etc. – gold tends to benefit during periods of higher volatility. Gold volatility has pulled back modestly, and in the context of higher US yields (both nominal and real) and a stronger US Dollar, gold prices are continuing to struggle.
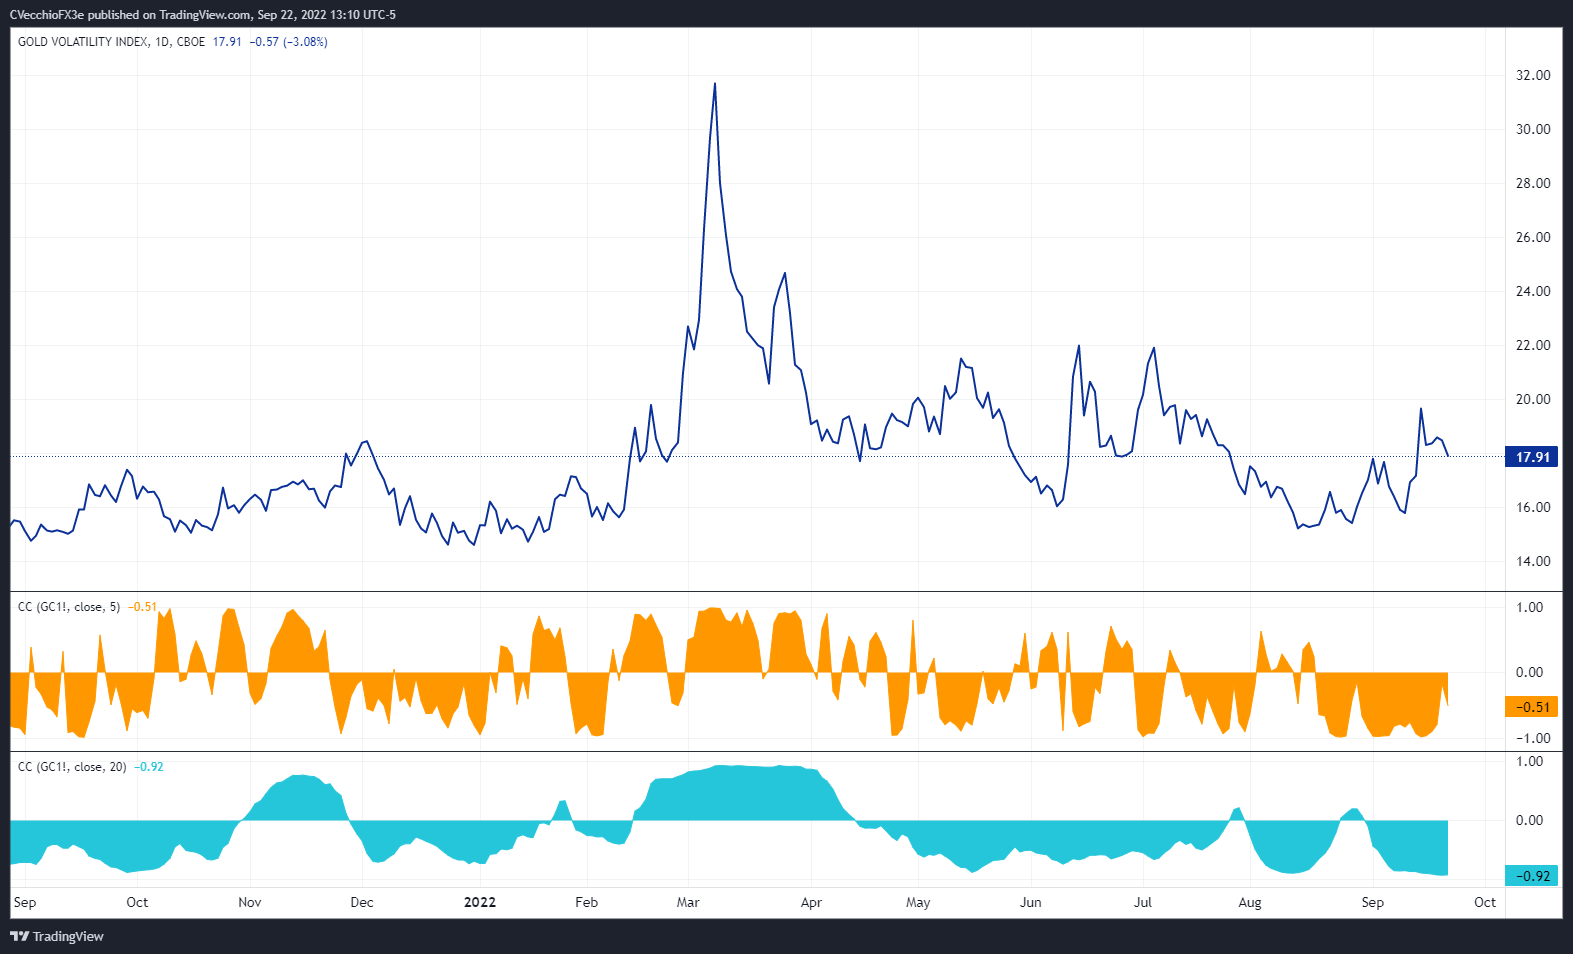
GVZ (Gold Volatility) Technical Analysis: Daily Price Chart (September 2021 to September 2022) (Chart 1)
Gold volatility (as measured by the Cboe’s gold volatility ETF, GVZ, which tracks the 1-month implied volatility of gold as derived from the GLD option chain) was trading at 17.91 at the time this report was written. The 5-day correlation between GVZ and gold prices is -0.51 while the 20-day correlation is -0.92. One week ago, on September 15, the 5-day correlation was -0.98 and the 20-day correlation was -0.89.
Gold Price Rate Technical Analysis: Daily Chart (August 2021 to September 2022) (Chart 2)

Last week it was noted that “a return to the yearly low can’t be ruled out in the near-term.” Gold prices fell through the former yearly low around 1680, carving out a September low and a 2022 low at 1653.87 yesterday. While there hasn’t been any significant downside follow-through, the fact of the matter is that gold prices are treating the 1680 area as a ceiling in recent days, suggesting that former support has become meaningful resistance.
Momentum is still bearish. Gold prices are bck below their daily 5-, 8-, 13-, and 21-EMAs, and the EMA envelope is in bearish sequential order. Daily MACD is trending lower below its signal line, and daily Slow Stochastics are holding in oversold territory. A drop below 1653.87 would open up the floor for a move into the 1630s by the end of the month.
Gold Price Technical Analysis: Weekly Chart (October 2015 to September 2022) (Chart 3)

The longer-term view is slightly evolving, although “a double top remains in place [and] a massive sideways range between 1680 and 2075 may have formed.” Momentum on the weekly timeframe remains bearish, with gold prices below their weekly 4-, 8-, and 13-EMA envelope, which is in bearish sequential order. Weekly MACD is still trending lower below its signal line, and weekly Slow Stochastics are in oversold territory. If gold prices fail to recover above 1680, the double top warrants a long-term – multi-month, if not multi-year – bearish perspective for gold prices.
Recommended by Christopher Vecchio, CFA
Building Confidence in Trading
IG CLIENT SENTIMENT INDEX: GOLD PRICE FORECAST (September 22, 2022) (Chart 4)

Gold: Retail trader data shows 81.23% of traders are net-long with the ratio of traders long to short at 4.33 to 1. The number of traders net-long is 4.75% lower than yesterday and 11.33% lower from last week, while the number of traders net-short is 15.92% lower than yesterday and 35.61% higher from last week.
We typically take a contrarian view to crowd sentiment, and the fact traders are net-long suggests Gold prices may continue to fall.
Positioning is more net-long than yesterday but less net-long from last week. The combination of current sentiment and recent changes gives us a further mixed Gold trading bias.
Trade Smarter – Sign up for the DailyFX Newsletter
Receive timely and compelling market commentary from the DailyFX team
Subscribe to Newsletter
— Written by Christopher Vecchio, CFA, Senior Strategist