[ad_1]
Gold, XAU/USD, Non-Farm Payrolls Report, IG Client Sentiment – Gold briefing:
- Gold prices on course for the worst week in about 2 months
- US non-farm payrolls report may bring more volatility next
- XAU/USD also at risk of more long bets from retail traders
Gold prices are on course for the worst week in about 2 months, with the yellow metal down about 3.7% before the weekend nears. A key driver of gold’s descent this week has been a stronger US Dollar. The greenback’s strength this week seems to have largely stemmed from external factors. The latter include monetary policy woes in Europe and developed countries that are at risk to global growth expectations.
On Thursday, Fedspeak seemed to play a key role in improving market sentiment. Fed’s Christopher Waller and James Bullard both underscored that the central bank has a ‘good chance’ of a soft landing. This confidence likely softened the US Dollar, allowing anti-fiat gold prices to find a stable footing after pronounced losses earlier this week.
Things will get more interesting over the remaining 24 hours. All eyes are on June’s non-farm payrolls report. The US is seen adding 268k jobs, down from 390k in May. But, more focus might be placed on average hourly earnings. A 5.0% y/y print is seen, down from 5.2% prior. If the central bank wants to anchor inflation expectations, then watching wages will be of utmost importance.
The Citi US Economic Surprise Index remains deeply in negative territory. This is a sign that analysts are overestimating the health of the economy, opening the door to downside surprises in data. A worrying sign for the Fed could come in the form of fewer, or even negative, job additions while earnings remain strong. That may bring up concerns about stagflation. As such, gold volatility may remain elevated.
Gold Technical Analysis
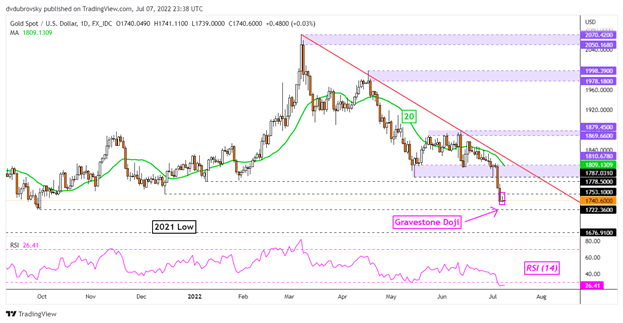
Gold prices have confirmed a breakout under the 1787 – 1810 support zone, subsequently passing through the December 2021 low at 1753. Over the past 24 hours, prices have left behind a Gravestone Doji candlestick pattern. This is a sign of indecision where upside follow-through could hint at further gains to come. In such a case, the 20-day Simple Moving Average (SMA) could come into play as key resistance. Otherwise, further losses would place the focus on the September 2021 low at 1722.
XAU/USD Daily Chart

Chart Created Using TradingView
Gold Sentiment Outlook – Bearish
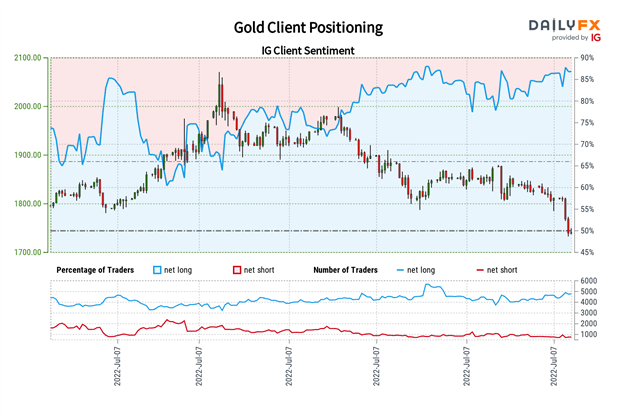
The IG Client Sentiment (IGCS) gauge shows that about 87% of retail traders are net-long gold. IGCS tends to behave as a contrarian indicator. As such, since the majority of traders are long, this suggests that XAU/USD may continue falling. Upside exposure has increased by 5.36% and 8.29% compared to yesterday and last week respectively. The combination of current sentiment and recent changes is offering a stronger bearish contrarian trading bias.

–— Written by Daniel Dubrovsky, Strategist for DailyFX.com
To contact Daniel, use the comments section below or @ddubrovskyFX on Twitter
[ad_2]
Source link
