
[ad_1]
Recommended by Diego Colman
How to Trade USD/JPY
USD/JPY TECHNICAL ANALYSIS
USD/JPY (US dollar – Japanese Yen) was cautious on Tuesday, moving between small gains and losses around the 138.50 level and showing signs of losing momentum following its stunning run over the past few weeks. For context, the pair has staged a solid rally since the beginning of the month, rising more than 3.4% after bouncing off its 50-day simple moving average – an important area of demand.
While USD/JPY’s technical outlook remains constructive, the pair may be in a consolidation phase for a few days, establishing a base around the 138.00 handle prior to the next leg higher. If this scenario plays out, prices may resume their ascent and challenge the psychological 140.00 level before the end of May. On further strength, the focus turns to 142.45, the 61.8% Fib retracement of the 2022/2023 slump.
Conversely, if the bears take advantage of market exhaustion and trigger a reversal, traders should watch support at 138.00, keeping in mind that a move below it could lead to a retest of the 200-day simple moving average. Sellers may struggle to breach this technical floor, but a breakdown could open the door for a pullback toward a short-term rising trendline at 135.00.
USD/JPY TECHNICAL CHART
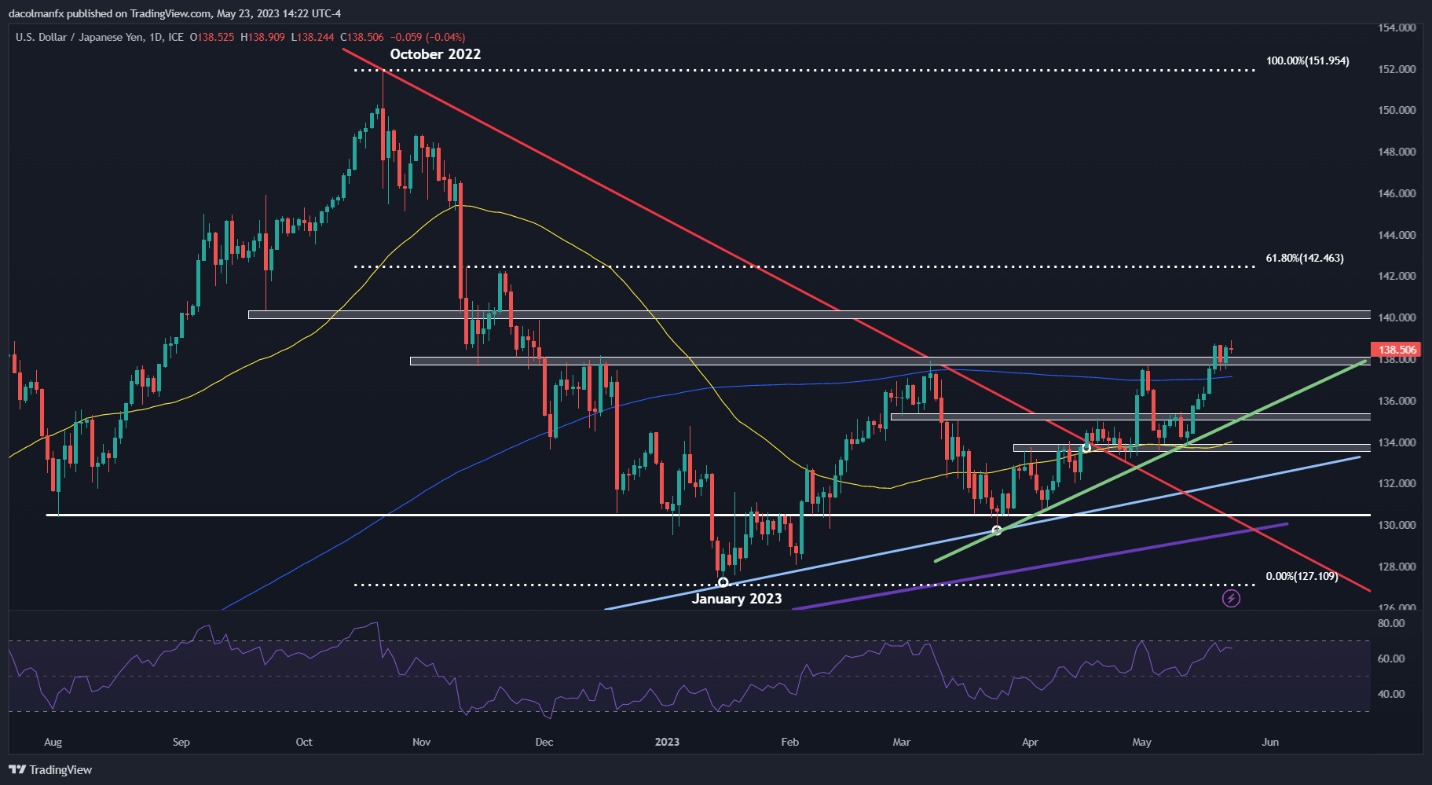
USD/JPY Chart Prepared Using TradingView
Recommended by Diego Colman
Get Your Free JPY Forecast
AUD/JPY TECHNICAL ANALYSIS
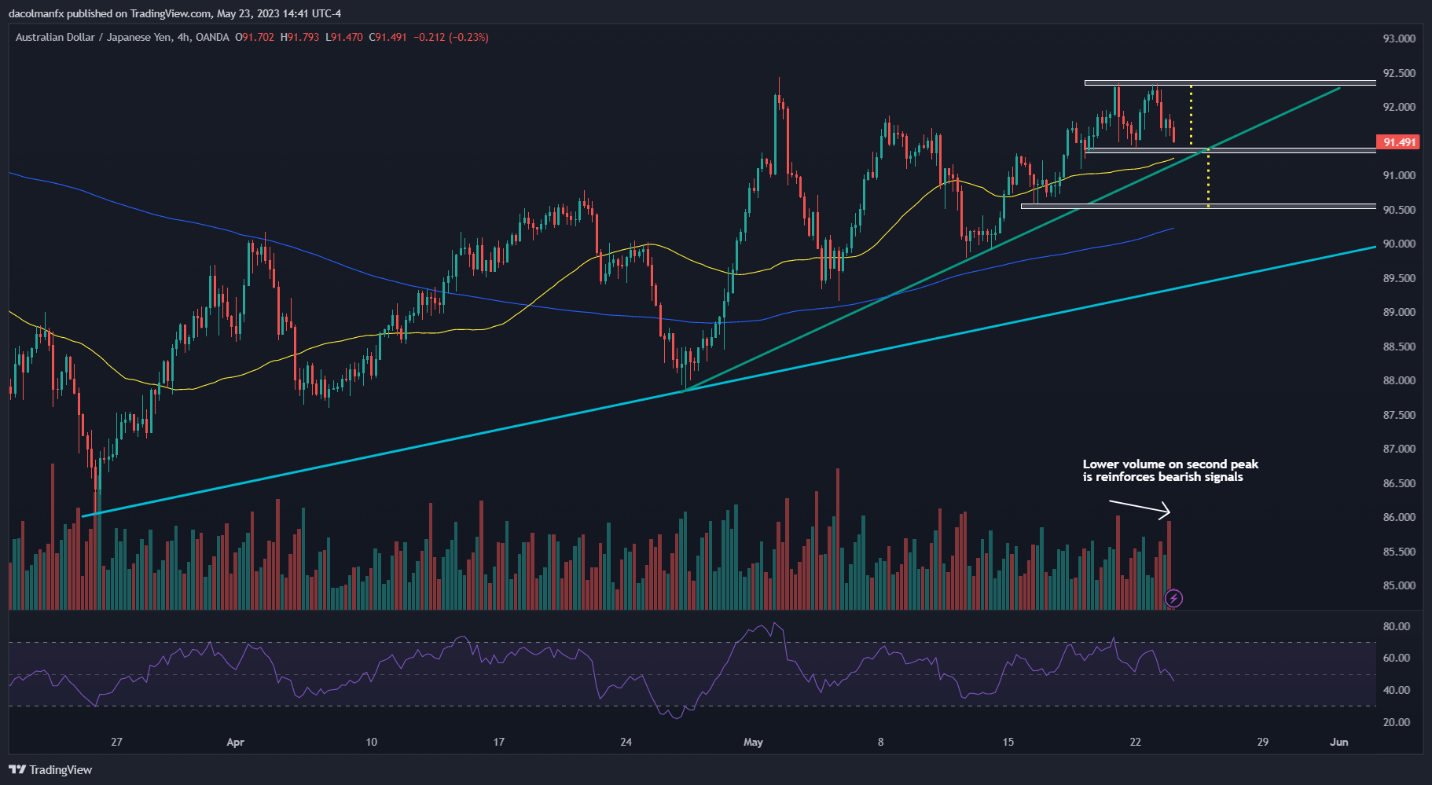
AUD/JPY (Australian dollar – Japanese yen) has been in a strong uptrend since late March, establishing higher highs and higher lows progressively, a clear indication that the bulls have been in control of the market for some time. Despite positive price action, buyers may have a reason to worry as the pair has been carving out a double top in recent weeks after failing to push above 92.35.
A double top is a reversal pattern that often develops in the context of an extended upward move, composed of two similar peaks separated by a depression. This bearish setup is confirmed once the price completes its “M” resembling shape and breaks below the technical support created by the formation’s intermediate through – the neckline.
In the case of AUD/JPY, the neckline sits at 91.40. If this floor caves in, a steep sell-off could follow in short order. The potential size of the downward retracement can be quantified by projecting vertically the height of the double top from the break point. This indicates the possibility of a decline towards 90.55 in the near term.
AUD/JPY TECHNICAL CHART
[ad_2]
Source link