[ad_1]
Silver Price Outlook:
- The losses for silver prices are deepening, suggesting a more significant top is forming.
- Silver prices’ momentum retains a severely bearish tone.
- Recent changes in sentiment suggest that silver prices have a mixed bias in the near-term.
Long-term Range Breaking
Silver prices are facing two significant problems from the fundamental perspective. First, The rise in nominal US Treasury yields coupled while US inflation expectations (as measured by breakevens and inflation swap forwards) falling back have provoked a surge in real US yields; historically, positive real US yields are correlated with losses by silver (and gold as well). Second, thanks to declining economic prospects across developed economies, silver’s industrial-usage role in the is being undercut as well.
In turn, the deteriorating fundamental narrative for silver prices is feeding a rapidly weakening technical outlook. Silver prices are experiencing significantly bearish momentum, all the while a multi-year range dating back to July 2020 now threatens to morph into a longer-term top.
Silver Prices and Volatility Relationship Erodes
Both gold and silver are precious metals that typically enjoy a safe haven appeal during times of uncertainty in financial markets. While other asset classes don’t like increased volatility (signaling greater uncertainty around cash flows, dividends, coupon payments, etc.), precious metals tend to benefit from periods of higher volatility as uncertainty increases silver’s safe haven appeal. Unfortunately for silver prices, the broader market volatility has been catalyzed by elevated Federal Reserve rate hike expectations feeding into rising US yields, which serve as a headwind.
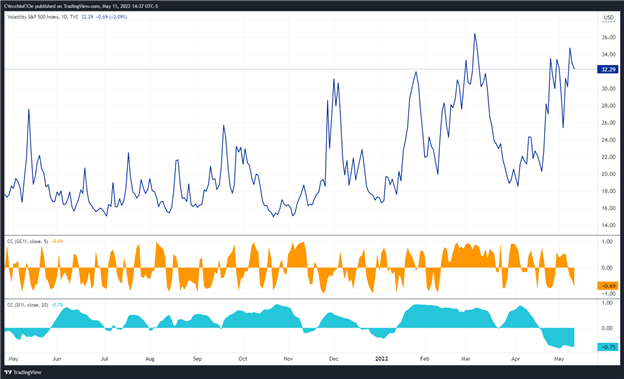
VIX (US S&P 500 VOLATILITY) versus Silver Price TECHNICAL ANALYSIS: DAILY PRICE CHART (May 2021 to May 2022) (CHART 1)
US stock market volatility (as measured by the US S&P 500 volatility index, VIX, which tracks the stock market’s expectation of volatility based on S&P 500 index options) was trading at 32.29 at the time this report was written. The 5-day correlation between the VIX and silver prices is -0.69 and the 20-day correlation is -0.75. One week ago, on May 4, the 5-day correlation was +0.51 and the 20-day correlation was -0.68.
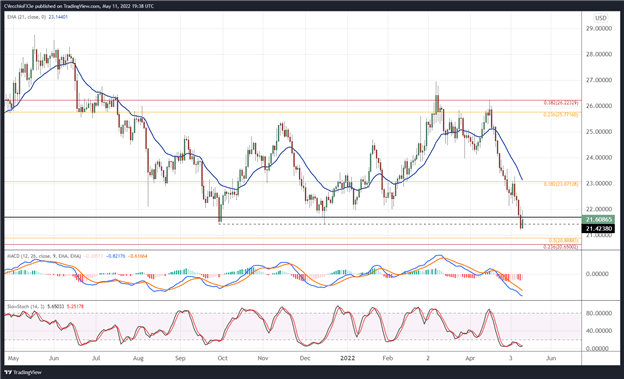
SILVER PRICE TECHNICAL ANALYSIS: DAILY CHART (May 2021 to May 2022) (CHART 2)
Silver prices just broke below their 2021 low yesterday, dropping below 21.4238 for the first time since July 2020. The rally attempt today to climb back above the near-two year range support is failing. Momentum retains an aggressively bearish profile. Silver prices are below their daily 5-, 8-, 13-, and 21-EMA envelope, which is in bearish sequential order. Daily MACD’s descent below its signal line continues unabated, while daily Slow Stochastics are nestled in oversold territory. A ‘sell the rally’ perspective remains appropriate for the near-future.
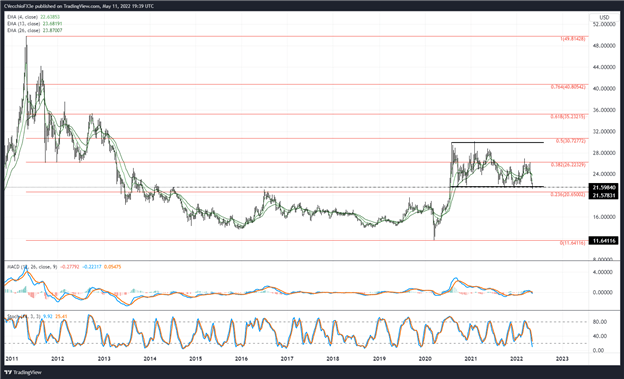
SILVER PRICE TECHNICAL ANALYSIS: WEEKLY CHART (November 2010 to May 2022) (CHART 3)
The longer-term view no longer warrants a neutral outlook if the range since July 2020 breaks to the downside; instead, a bearish outlook would be appropriate. Like on the daily timeframe, momentum is increasingly negative on the weekly chart: silver prices below their weekly 4-, 8-, and 13-EMAs, which are aligning in bearish sequential order. Weekly MACD is crossing below its signal line, while weekly Slow Stochastics have moved into oversold territory for the first time in 2022. A return to the 23.6% Fibonacci retracement of the 2011 high/2020 low range at 20.6500 would be the first target to the downside.
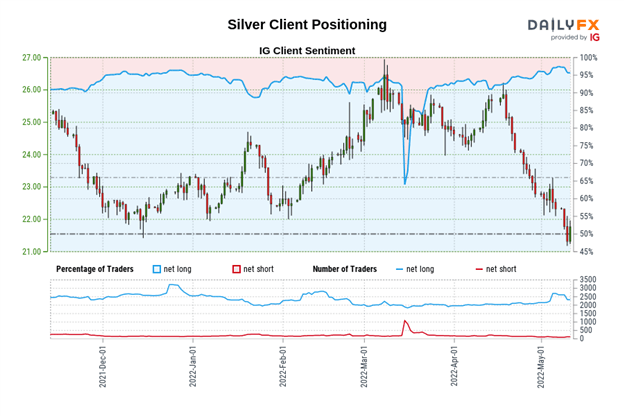
IG CLIENT SENTIMENT INDEX: SILVER PRICE FORECAST (May 11, 2022) (CHART 4)
Silver: Retail trader data shows 95.87% of traders are net-long with the ratio of traders long to short at 23.20 to 1. The number of traders net-long is 2.43% lower than yesterday and 5.77% higher from last week, while the number of traders net-short is 2.00% higher than yesterday and 9.73% lower from last week.
We typically take a contrarian view to crowd sentiment, and the fact traders are net-long suggests Silver prices may continue to fall.
Positioning is less net-long than yesterday but more net-long from last week. The combination of current sentiment and recent changes gives us a further mixed Silver trading bias.
— Written by Christopher Vecchio, CFA, Senior Strategist
[ad_2]
Source link


