[ad_1]
S&P 500, Inflation, Federal Reserve, FOMC – Talking Points
- S&P 500 remains below resistance around 3980
- FOMC minutes set to drop at 16:00 GMT
- Minutes may offer more clarity on QT, balance sheet path
The S&P 500 continues to perch just above bear market territory as market participants eagerly await the release of FOMC minutes. Markets have been jittery of late, as financial conditions have tightened considerably from just a few months ago. The dive in risk assets culminated with the S&P trading into bear market territory on an intraday basis just last week, but we have yet to close below that threshold. The macro climate remains in focus for many, with Snapchat’s revised guidance yesterday stoking fears about growth and a potential recession.
Following a weak durable goods print in the premarket session, followers of the economic calendar now turn their attention to the release of the FOMC minutes at 16:00 GMT. With the market effectively priced for two consecutive 50 basis point hikes from the Fed, the minutes may go a long way to decoding the intended path for balance sheet reduction. At the May meeting, the FOMC revealed that from June 1, the balance sheet would be trimmed at a rate of $47.5 billion per month, ultimately rising to $95 billion after 3 months. With questions still looming over the Fed’s MBS (mortgage-backed securities) holdings, any clarity as to potential MBS sales down the road may be key.
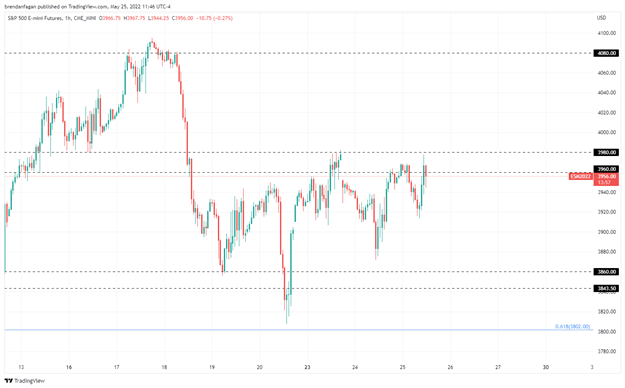
S&P 500 Futures (ES) 1 Hour Chart
Chart created with TradingView
S&P 500 futures (ES) have been choppy of late, as the tightening of financial conditions continues to take its toll on the major US equity benchmarks. For much of the last week, 3960 has penned in price apart from a few minor overshoots. As liquidity continues to tighten and the Fed moves toward neutral policy, the outlook for risk assets remains bleak. It would appear that we firmly remain in a “sell the rally” environment, with each rebound of late being faded in the following sessions.
That being said, the S&P 500 could bounce from current levels given positioning and sentiment being overly bearish. The 3800 area represents the 0.618 Fibonacci retracement of the March 2020 to January 2022 ramp to all-time highs. This could allow for a relief rally in the short term, but ultimately the bottom may not be in until (or if) the Fed “blinks” and pivots on policy. Near-term, the S&P 500 may continue to oscillate in the range we’ve carved out between 3860 and 3960.
Resources for Forex Traders
Whether you are a new or experienced trader, we have several resources available to help you; indicator for tracking trader sentiment, quarterly trading forecasts, analytical and educational webinars held daily, trading guides to help you improve trading performance, and one specifically for those who are new to forex.
— Written by Brendan Fagan, Intern
To contact Brendan, use the comments section below or @BrendanFaganFX on Twitter
[ad_2]
Source link
