
[ad_1]
How do you know if an economy is headed into a recession? You don’t, until it’s already in one.
That’s the implication of a little-known indicator that keys off the difference between two separate measures of consumer sentiment. Fed Chair Jerome Powell didn’t make any mention of this indicator in his news conference on Wednesday, but I wouldn’t be surprised if he and other Fed officials are aware of it.
In fact, Powell appeared to at least somewhat backpedal on his previous forecasts of a so-called “soft landing,” now saying that such an outcome is “possible” —a nd that the Fed’s interest-rating setting committee does not consider a soft landing as the “baseline expectation.”
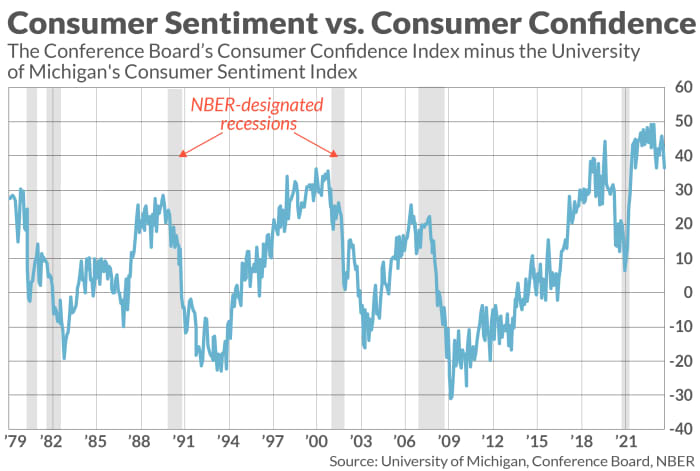
The indicator I’m referring to is constructed by subtracting the University of Michigan’s Index of Consumer Sentiment (UMICS) from the Conference Board’s Consumer Confidence Index (CCI). Since 1979, which is how far back monthly data extend for both indexes, recessions were imminent whenever this spread greatly widened and then began to narrow.
These preconditions have been met, as you can see from the accompanying chart. After widening to a record last December of 49.3 percentage points, the spread currently stands at 36.6 percentage points — a narrowing of 12.7 percentage points. On average prior to the five recessions from 1979 up to and including the 2008 Global Financial Crisis, the spread had declined 9.7 points by the time the recession began. (I ignored the early 2020 COVID pandemic recession because it was so unique.)
I wrote about this indicator last May, when it had already narrowed 11.3 percentage points since its December 2022 reading. Skeptics point out that, notwithstanding this narrowing that had already occurred, the U.S. economy since then has remained strong. But I don’t put too much weight on this objection, since there often is a long lag between when a recession begins and when the National Bureau of Economic Research announces that one has begun. (The NBER is the semi-official arbiter of when recessions begin and end.) Historically, according to the NBER, this lag has been anywhere between four and 21 months; in the case of the most recent recession it was 15 months.
Why the indicator works
The indicator keys off the different aspects of consumers’ mood that the CCI and the UMICS measure. According to James Stack of InvesTech Research, from whom I first heard about this indicator, the CCI more heavily reflects consumers’ attitudes towards the overall economy, while the UMICS is more heavily weighted towards their immediate personal circumstances.
The theory behind the indicator is that, when the economy starts to weaken, consumers initially become concerned about their own personal circumstances while remaining upbeat about the economy in general — causing the spread between the two consumer measures to widen. A recession becomes imminent when this souring spreads from consumers’ personal situations to worrying about the economy generally — which has the effect of narrowing that spread.
Further empirical support for the indicator is its track record in forecasting the S&P 500’s
SPX
total real return. As you can see from the chart below, the U.S. stock market has turned in losses, on average, in the wake of the 10% of months in which the indicator was greatest. Its latest readings are solidly within this top decile.
| When the CCI level minus the UMICS level was… | S&P 500’s average total real return over subsequent 12 months | S&P 500’s average total real return over subsequent 5 years (annualized) |
| The 10% of months since 1979 when the spread was greatest | -2.2% | -4.3% |
| The 10% of months since 1979 when the spread was lowest | +14.1% | +14.8% |
Mark Hulbert is a regular contributor to MarketWatch. His Hulbert Ratings tracks investment newsletters that pay a flat fee to be audited. He can be reached at mark@hulbertratings.com
More: This former Fed insider has 3 big takeaways from Powell’s press conference
Plus: Fed predicts ‘soft landing’ for the economy — low inflation and no recession
[ad_2]
Source link