- Haven-linked US Dollar declines as Wall Street continues higher
- Traders seem to be ignoring clearly not-dovish Fed commentary
- Still, Bear Flag remains key technical downside setup on the daily
Recommended by Daniel Dubrovsky
Traits of Successful Traders
Asia-Pacific Market Briefing – US Dollar Keeps Diverging from the Fundamentals
The US Dollar extended lower on Thursday with the DXY Index falling 0.46 percent. As March wraps up, the currency is down about 2.6% and is on course for the worst monthly performance since November.
The haven-linked US Dollar underperformed amidst a general improvement in risk appetite once again. On Wall Street, the tech-heavy Nasdaq 100 rallied 0.9%. This is as the S&P 500 and Dow Jones gained 0.57% and 0.43%, respectively. The VIX market ‘fear gauge’ also fell and is on course for a 12.5% decline this week.
The dollar’s decline occurred despite a lack of dovish commentary from the Federal Reserve. Multiple Fed officials spoke over the past 24 hours. Thomas Barkin, President of the Richmond Fed, noted that he is comfortable with hiking rates by 25-basis point increments. Meanwhile, Susan Collins, President of the Boston Fed, said the central bank needs to hold rates high all year to bring down inflation.
This means that traders have been slowly unwinding rate-cut bets since Silicon Valley Bank’s collapse earlier this month. The 2-year Treasury yield gained on Thursday, further confirming fading Fed rate cut expectations.
Where does this leave the US Dollar going forward? The divergence between USD and Fed policy bets could be setting the stage for a future comeback in the greenback. All eyes turn to PCE data at 12:30 GMT. This is the Fed’s preferred inflation gauge. Stubbornly high inflation could cause markets to focus back on a hawkish Fed, further reducing rate-cut bets. That may benefit USD.
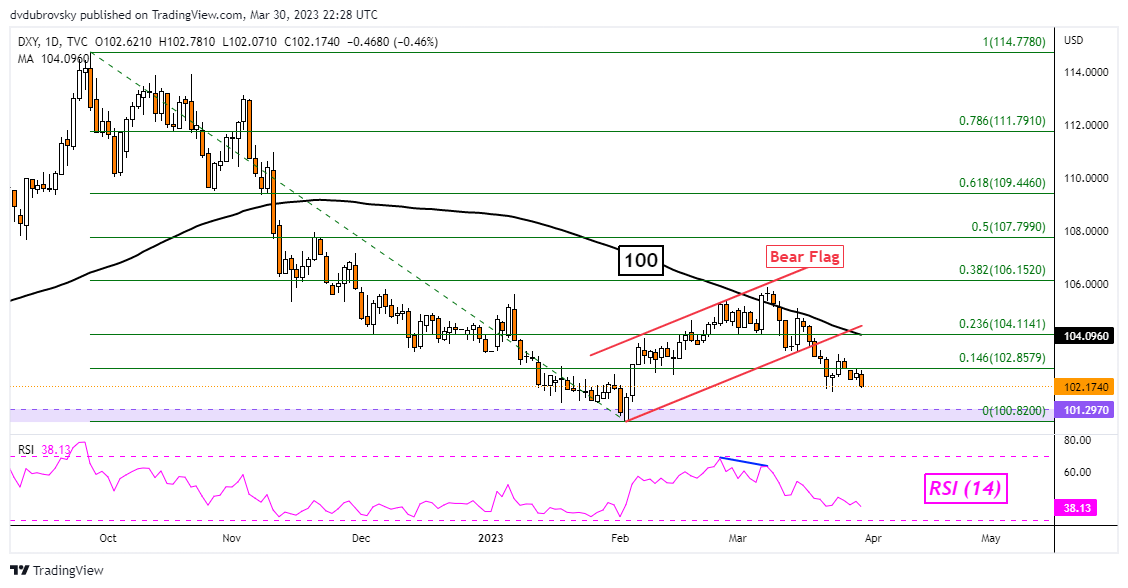
US Dollar Technical Analysis
On the daily chart, the DXY continues to make downside progress after a Bear Flag. This is an increasingly bearish sign. Still, the broader objective for the downside remains the 100.82 – 101.29 support zone, which was established in early February. Clearing this range would open the door to extending the near-term downward bias. Immediate resistance seems to be the 100-day Simple Moving Average (SMA).
Trade Smarter – Sign up for the DailyFX Newsletter
Receive timely and compelling market commentary from the DailyFX team
Subscribe to Newsletter
— Written by Daniel Dubrovsky, Senior Strategist for DailyFX.com
To contact Daniel, follow him on Twitter:@ddubrovskyFX