
[ad_1]
US Dollar, USD/SGD, USD/THB, USD/PHP, USD/IDR – ASEAN Technical Analysis
- US Dollar weakened against most ASEAN currencies this past week
- Key uptrends remain in USD/SGD, USD/THB, USD/PHP, USD/IDR
- Watch if there is further downside confirmation, which may spell trouble
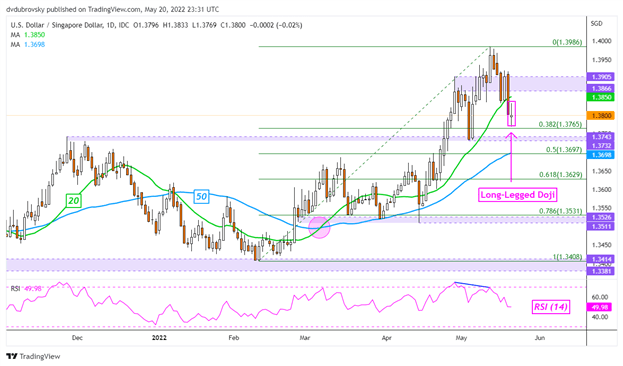
Singapore Dollar Technical Outlook – Neutral
The US Dollar weakened against the Singapore Dollar this past week. Still, USD/SGD’s uptrend since February still remains intact. Prices left behind a neutral long-legged Doji candlestick pattern above the 38.2% Fibonacci retracement. This is a sign of indecision. An upside close could hint at resuming the climb towards the May high at 1.3986. Otherwise, confirming a breakout lower places the focus on the 50-day Simple Moving Average (SMA).
USD/SGD Daily Chart
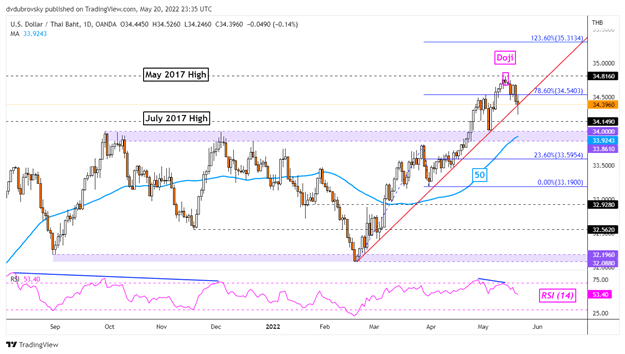
Thai Baht Technical Outlook – Slightly Bullish
The US Dollar also underperformed against the Thai Baht this past week. Interestingly, USD/THB was unable to hold a close under the rising trendline from February. This is maintaining the bullish outlook, though a breakout under the line could shift the view increasingly bearish. That would place the focus on the 50-day SMA below. Otherwise, uptrend resumption entails a push above the April 2017 high at 34.816. That would expose the 123.6% Fibonacci extension at 35.313.
USD/THB Daily Chart
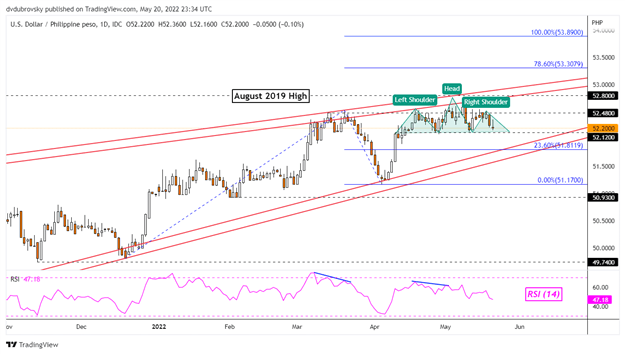
Philippine Peso Technical Outlook – Neutral
The US Dollar remained in a consolidative state against the Philippine Peso. Broadly speaking, USD/PHP continues to trend upwards within a Rising Wedge chart formation for almost a year. As such, the broader outlook remains bullish. In the near term, prices appear to be forming a bearish Head and Shoulders. Closing under the neckline around 52.120 could hint at further weakness, placing the focus on the floor of the wedge. Otherwise, a bounce on support would bring the August 2019 high at 52.80 into focus.
USD/PHP Daily Chart
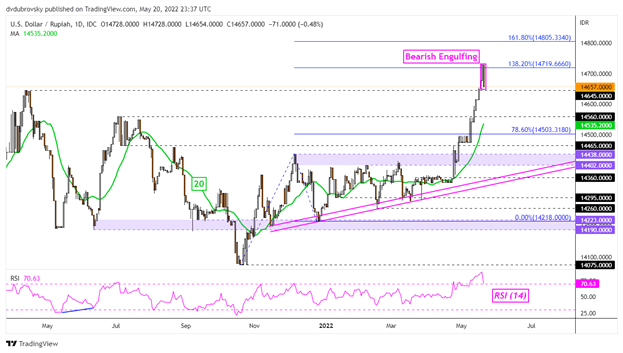
Indonesian RupiahTechnical Outlook – Slightly Bullish
The US Dollar finished higher against the Indonesian Rupiah this past week. However, USD/IDR left behind a Bearish Engulfing candlestick pattern. This does not mean that a turn lower is impending, though traders should keep an eye on what happens in the days ahead. Further downside confirmation could open the door to extending losses, placing the focus on the 20-day SMA. Otherwise, extending gains exposes the 161.8% Fibonacci extension at 14805.
USD/IDR Daily Chart
–— Written by Daniel Dubrovsky, Strategist for DailyFX.com
To contact Daniel, use the comments section below or @ddubrovskyFX on Twitter
[ad_2]
Source link