[ad_1]
US Dollar Talking Points:
- The US Dollar posed a mild pullback this morning after CPI was released for the month of March, coming in at a whopping 8.5% while core CPI printed at 6.5%.
- The bullish trend in the US Dollar was holding near resistance ahead of the release and this morning’s data brought a mild pullback that, so far, bulls have bid. Below I look at strategy parameters in three of the larger USD-pairs of EUR/USD, GBP/USD and USD/JPY.
- The analysis contained in article relies on price action and chart formations. To learn more about price action or chart patterns, check out our DailyFX Education section.
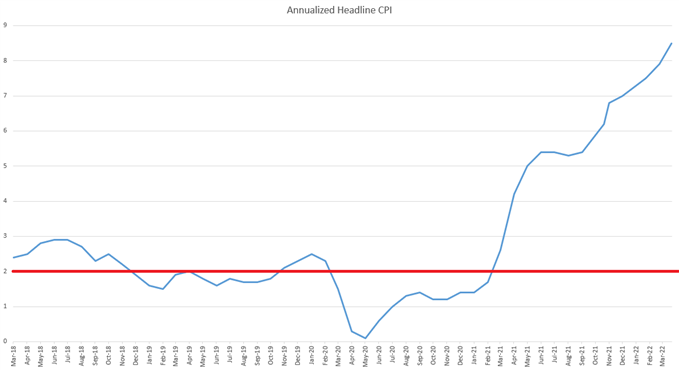
This morning brought the release of March CPI figures into markets and, once again, the headline CPI print came out above expectations. This time, however, we crossed the 8% marker with an 8.5% print, constituting yet another fresh 40-year high.
There was a silver lining however as core CPI, stripping out food and energy, came in a bit below expectations, printing at 6.5% versus the expected 6.6%.
But, inflation has spiked in a big way and the below chart, with a red line all the way down around the Fed’s target, helps to show this recent theme.
Headline CPI Annualized Since March, 2018
Chart prepared by James Stanley
At this early stage of the matter it would seem that this is what market participants are focusing on as the ground was already set for another massive print today, after the White House warned of another elevated inflation reading ahead of today’s data release. Trends of USD-strength have already been well built-in and likely we’re seeing a bit of profit taking after another bump up to a fresh yearly high was not followed by an aggressive bullish reaction after this CPI release.
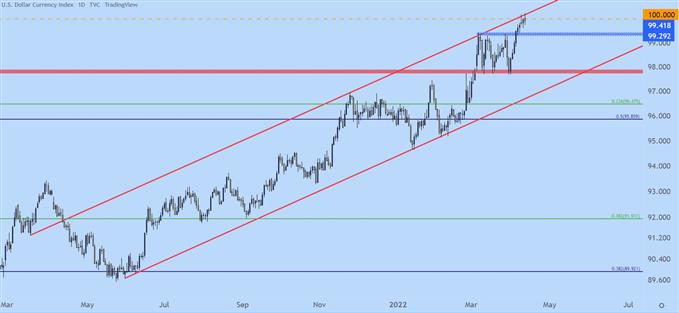
We can see that well-built trend on the daily chart below, with the past two trading days producing resistance inflections off of the topside of the bullish channel that’s now been in-play for about a year.
US Dollar Daily Price Chart
Chart prepared by James Stanley; USD, DXY on Tradingview
US Dollar Support Potential
At this point, pullbacks in the US Dollar have been relatively shallow including this morning’s move after the release of CPI data.
But, given that the USD has just re-engaged with the psychological level at 100 and taken with the fact that there’s been very little give in the trend since the last support test in late-March, and price could be due for a pull back.
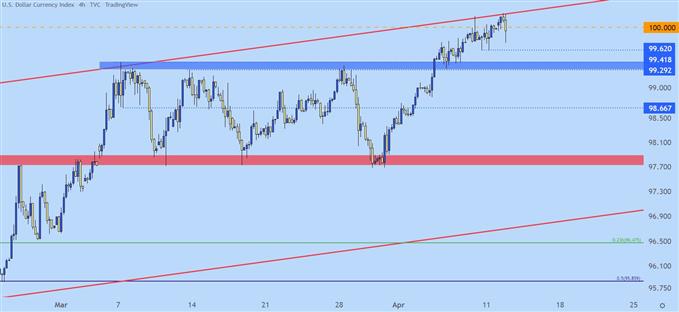
There’s even a fairly attractive area to look towards, as there was a prior spot of resistance from a range that had built-in during March trade and, as yet, that zone hasn’t been re-tested for support since the topside breakout. There’s a more aggressive support level plotted before that zone comes into play, around 99.62.
US Dollar Four-Hour Price Chart
Chart prepared by James Stanley; USD, DXY on Tradingview
EUR/USD Remains at Key Area
The key for the US Dollar’s breakout potential is related to the possibility of breakdown in EUR/USD. The Euro is 57.6% of the DXY quote so, logically, the Dollar is going to have a difficult time going anywhere without at least some participation from the Euro.
In EUR/USD, that argument is complicated by the fact that prices have just moved down to a major spot of long-term support.
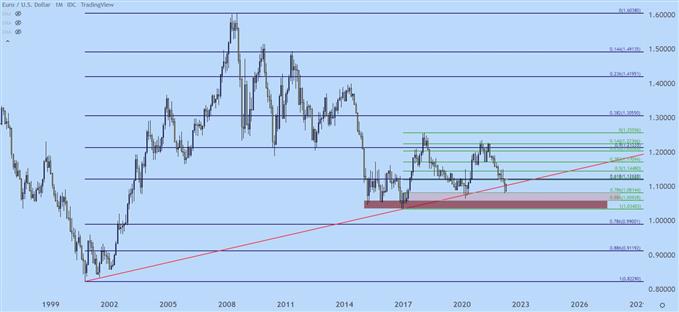
From the monthly chart below, we can see a strong show of support in the current area back in 2020. That ultimately led to a massive bounce of more than 1,500 pips as the Fed warmed up the money printer during 2020 and 2021 trade.
But as the tides have started to go back out sellers have already pushed the pair right back down to that big spot of support. And this can be a tough area for sellers to break-through.
EUR/USD Monthly Price Chart
Chart prepared by James Stanley; EURUSD on Tradingview
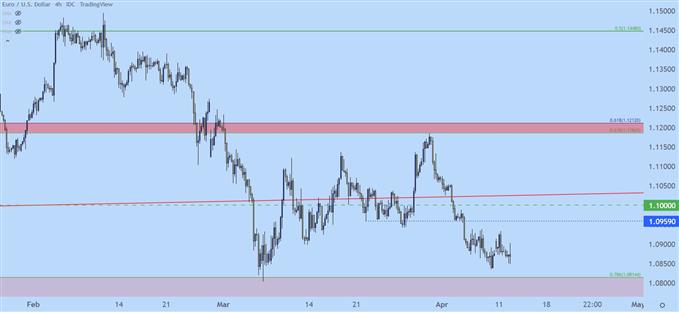
EUR/USD Shorter-Term
That long-term support doesn’t necessarily nullify bearish EUR/USD themes. It does, however, make for a more difficult justification when we have a situation such as we have right now, when prices have pulled up short of a support test after a recent higher-low.
To get that support breach, we’d need new sellers to enter the market and if matters are already fairly oversold, we may be in a state of stasis for a while. What could be helpful is a pullback, which could allow shorter-term bearish trend strategies to get back into order. There’s a prior swing of support around 1.0960 and then the 1.1000 psychological level, each of which could be of interest for such an approach. A bit higher we have the longer-term trendline projection and that currently projects to around 1.1025, and this could be looked to as a third spot of possible lower-high resistance for bearish continuation approaches.
EUR/USD Four-Hour Price Chart
Chart prepared by James Stanley; EURUSD on Tradingview
GBP/USD
One pair that hasn’t been as bashful about its bearishness of late is GBP/USD.
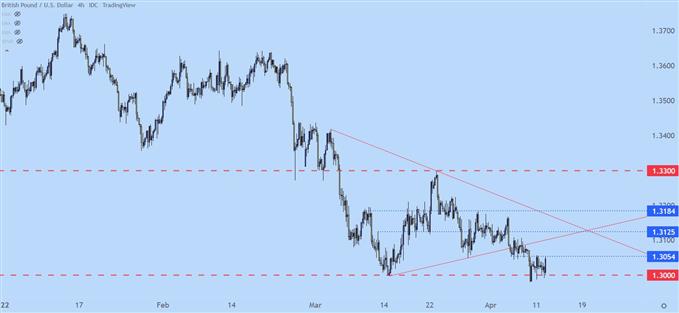
We ran into a similar situation as the above in Cable in mid-March, when the pair plummeted down to the 1.3000 psychological level. That provided a quick save for GBP/USD and the pair then went on a 300 pip incline before finally topping out at the 1.3300 handle.
Sellers have remained fairly consistent since that, however, and this has led to another re-test of the major psychological level. And at this point there’s been some bend but no significant break, which further indicates that the pair may be oversold and due for a pullback before new sellers came jump into push down to fresh lows.
Aggressive resistance can be sought out very nearby, around the 1.3054 level that’s support-turned-resistance. This price has already been tested and bulls haven’t backed down yet, which keeps the door open for a run up to the 1.3100 area and there’s a possible swing of resistance around 1.3124 which remains of interest.
GBP/USD Four-Hour Price Chart
Chart prepared by James Stanley; GBPUSD on Tradingview
USD/JPY Touches the 20-Year High
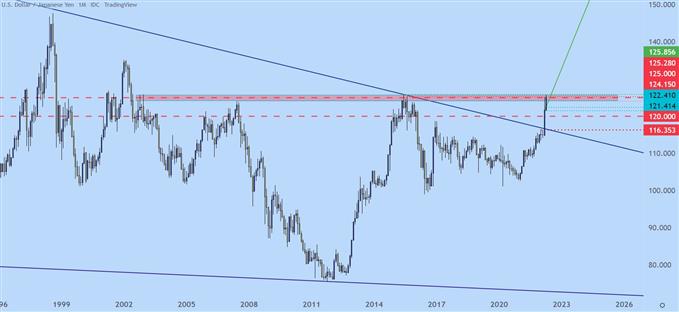
In the realm of bullish USD setups few have held the attractiveness of USD/JPY. And given rate differentials, that makes sense, and at this point the pair is pressing on 20-year highs as US rates continue to fly-higher where there’s little indication of anything similar on the cards for Japan.
USD/JPY Monthly Price Chart: 20 Year Highs
Chart prepared by James Stanley; USDJPY on Tradingview
This is the carry trade and when it shows up, it can be incredibly impactful. It’s what we were talking about last Q1 when the ‘reflation trade’ was starting to get priced-in and more pointedly, this came back into the equation last September when the FOMC started forecasting rate hikes for 2022. I had even set GBP/JPY as my ‘Top Trade’ for Q4 of last year on that very basis, and six months later those themes are still running strong.
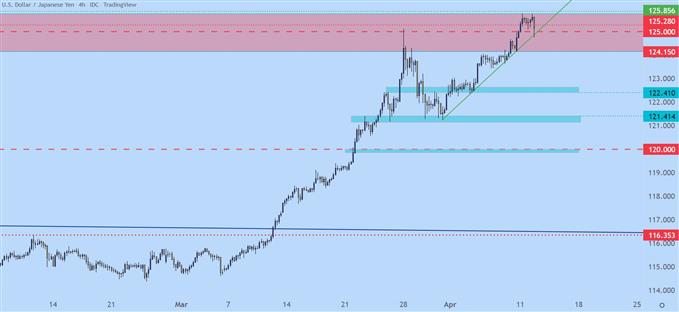
In USD/JPY, we’ve hit a point of interest as the last time USD/JPY traded in this region, we heard BoJ Governor Kuroda stomp the breaks, and this has led to a bit of caution as USD/JPY trades up to and around the 125.86 high water mark. This is the same thing that helped to produce the pullback in the pair a couple of weeks ago but with no signs of the BoJ adapting, bulls have simply bid the pair off of support while pushing up to those fresh 20-year highs.
USD/JPY Four-Hour Price Chart
Chart prepared by James Stanley; USDJPY on Tradingview
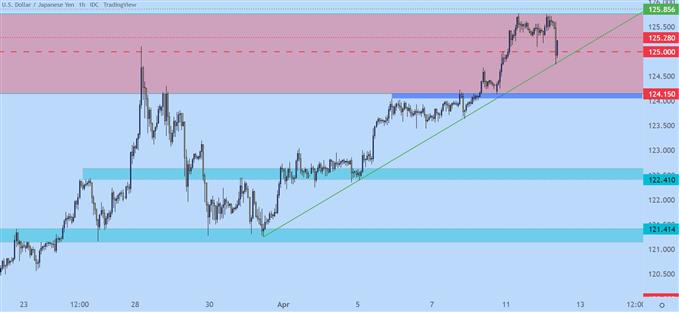
USD/JPY can be a pair that remains attractive for USD continuation scenarios. We’ve already seen support show off of the 125 psychological level this morning after the CPI print and buyers reacted swiftly with some help from the bullish trendline.
But – if we do see a failure to push a fresh high, followed by pullback, there’s a couple areas of interest that remain for bullish trend continuation scenarios. The prior swing-low turned support around 124.15 sticks out as a possible spot for such an approach.
USD/JPY Hourly Price Chart
Chart prepared by James Stanley; USDJPY on Tradingview
— Written by James Stanley, Senior Strategist for DailyFX.com
Contact and follow James on Twitter: @JStanleyFX
[ad_2]
Source link
