[ad_1]
US Dollar Technical Forecast: Bullish
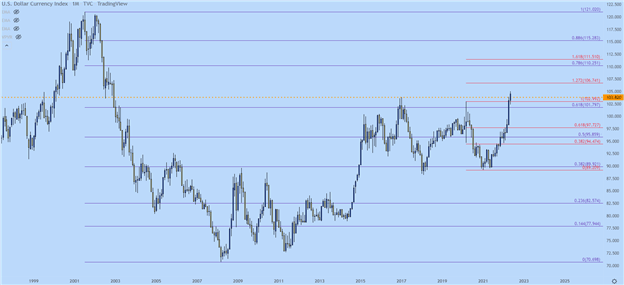
It was another week of strength for the US Dollar as the currency put in its sixth consecutive week of gains. Perhaps more impressive than that though, is where on the chart this took place. Last week saw the USD push up to a fresh 19-year high and there was even a bit of stall that showed around the 103.82 level. And for the first three days of last week, that theme remained, with prices holding around that resistance, giving the appearance of pullback potential.
But bulls wouldn’t allow for it and, instead, price broke out on Thursday and continued higher on Friday. DXY set a fresh 19-year-high at the 105.00 psychological level which, perhaps ironically, was partially fueled by a EUR/USD breakdown below its own 1.0500 level.
US Dollar
The Greenback remains in rarified air as the currency doesn’t have much recent historical context at current levels. The last time the USD was in this vicinity – there was no such thing as Bitcoin and even the idea of social media was far off from reality.
The US Dollar was also on its way down, back in 2002 when DXY was at the 105 handle, and prices were plunging as the Euro was gaining acceptance and receiving flows from Central Banks. And as global Central Banks and US trade partners shifted some allocation away from the USD and towards the Euro, that allowed for a clear trend to take-hold from 2002-2008.
What’s happening now though, is somewhat of the opposite of that, with the Euro continuing on its rather threatening plunge. And given that bulls have just crossed a pretty major line-in-the-sand, there’s no sign of this letting up anytime soon.
The forecast will be set to bullish on USD for the week ahead.
US Dollar Monthly Price Chart
Chart prepared by James Stanley; USD, DXY on Tradingview
EUR/USD
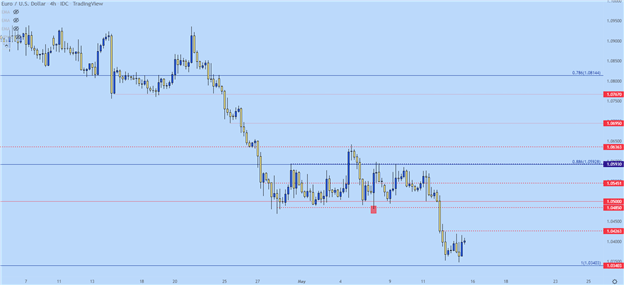
The door was wide open for a bounce this week. The 1.0500 level had held for ten consecutive trading days and this is after a really extended downside run. Logically, that level kept the door open for pullbacks and we did see a mild one two weeks ago, with price pushing up to the 1.0636 level, which was the swing low from March of 2020 as covid was getting priced-in.
On Thursday, the pair broke down to another fresh low, this time a fresh five-year-low. Price action was 12 pips away from testing through that level when a bit of support showed up on Thursday and held through Friday.
At this point, it’s difficult to get excited about much more than a pullback here and this would be an avenue that traders could follow for lower-high resistance, looking for continuation of the bearish trend in EUR/USD and the bullish trend in the USD.
On the below EUR/USD chart, I’ve outlined a few nearby swings of interest for such an approach. The area of prior support from the range, plotted from around 1.0485-1.0500 remains of interest. Above that, the approximate mid-point of the prior range comes into play, which I’m plotting around 1.0545. And beyond that we have the same 1.0636 low from 2020 that was resistance in early-May.
EUR/USD Four-Hour Price Chart
Chart prepared by James Stanley; EURUSD on Tradingview
GBP/USD
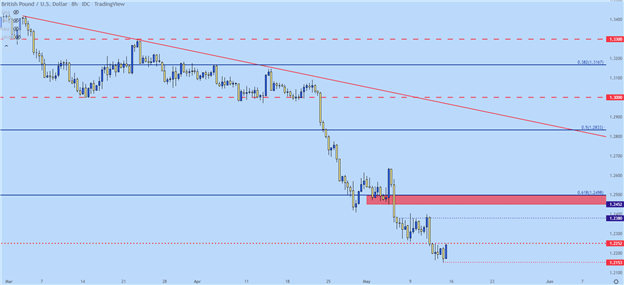
It’s been a rocky road of recent for Sterling bulls. The pair broke down through a descending triangle last month and since then there’s been a lot of carnage. GBP/USD set a fresh low at 1.2153 last week which is more than 800 pips away from where it was just a few weeks ago.
This one differs a bit from EUR/USD above, largely in the fact that EUR/USD did get that 10-day range build while GBP/USD remained in a somewhat bearish state. So, there may be a bit more of a pull for a pull back here, largely on the basis of how oversold the pair is. But, similarly, there’s little sign of anything more than that yet, and traders can follow the pair for lower-high resistance in the effort of following bullish continuation in the USD.
For resistance potential, there’s a spot at 1.2380 that’s of interest after which the zone running from 1.2452-1.2500 comes into play.
GBP/USD Eight-Hour Price Chart
Chart prepared by James Stanley; GBPUSD on Tradingview
AUD/USD
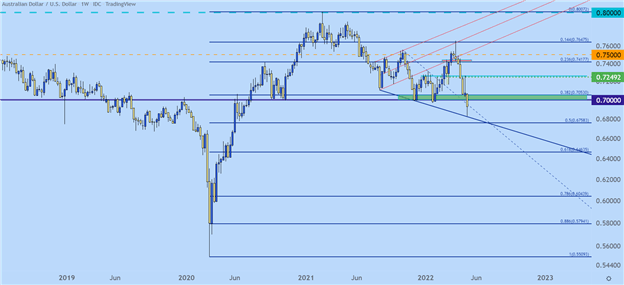
The Aussie has put in a massive reversal since the April open. The currency came into the period as one of the strongest currencies not named the ‘US Dollar.’ But what started as a slow turn in early-April has really heated up, with last week showing a bearish break of the psychological level at the .7000 handle. This was the same level that reversed the tides in early-February to lead to that theme of strength. That bearish move this week also amounted to a fresh yearly low in the pair.
At this stage, the trend looks to hold some promise to the downside. The challenge here would be one of chart position after a strong sell-off. Resistance at prior support, taken from around the .7000 psychological level could be of interest for bears. That could extend up to around .7053 which is a Fibonacci level of note to create a zone of resistance potential.
AUD/USD Weekly Price Chart
Chart prepared by James Stanley; AUDUSD on Tradingview
USD/JPY
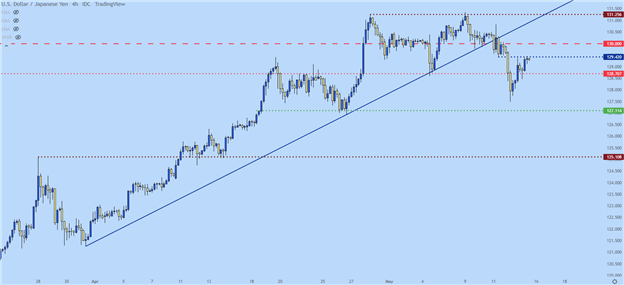
USD/JPY started to stumble this week. While USD/JPY was a driving component of that bullish move in the USD over the past few months, the Greenback’s run this week was even more impressive considering that the Japanese Yen didn’t play a significant role. As a matter of fact, the Yen was actually stronger than the USD this week, as evidenced by the bearish candle that just printed on the weekly chart.
Shorter-term holds some allure for the same, with price breaching a bullish trendline that had held the lows since late-March.
There may still be some bearish scope for the pair, although I’d relegate that to short-term scenarios at this point, at least until more information becomes clear that bears might be willing to push. And, really, for that, it appears that we’re looking for some hints of change around the Bank of Japan. At this point, there’s a bit of short-term resistance around prior support, plotted at around 129.42. Above that the 130 level looms large and if bulls can pose a re-break, then the bearish pullback scenario probably won’t look as attractive.
USD/JPY Four-Hour Price Chart
Chart prepared by James Stanley; USDJPY on Tradingview
— Written by James Stanley, Senior Strategist for DailyFX.com
Contact and follow James on Twitter: @JStanleyFX
[ad_2]
Source link
