[ad_1]
Japanese Yen Talking Points
USD/JPY initiates a series of higher highs and lows after snapping the opening range for May, but recent developments in the Relative Strength Index (RSI) raises the scope for a larger pullback in the exchange rate as the momentum indicator develops a downward trend.
USD/JPY Susceptible to Larger Correction as RSI Develops Downward Trend
USD/JPY continues to track the swings in US Treasury yields as it extends the rebound from the monthly low (127.52), and it remains to be seen if fresh data prints coming out of the US will influence the exchange rate as the Retail Sales report is anticipated to show a pickup in household consumption.

Retail spending is projected to increase 0.9% in April after expanding 0.5% the month prior, and indications of a robust economy may encourage Federal Reserve Chairman Jerome Powell to prepare US households and businesses for higher interest rates as the central bank head is scheduled to speak at an event held by the Wall Street Journal.
As a result, expectations for a further shift in Fed policy may keep USD/JPY afloat with the central bank on track to “significantly reduce the size of our balance sheet over time in a predictable manner,” and the decline from the yearly high (131.35) may turn out to be a correction in the broader trend amid the diverging paths between the Federal Open Market Committee (FOMC) and the Bank of Japan (BoJ).
Keep in mind, the divergence between price and the RSI raises the scope for a larger pullback in USD/JPY as the oscillator develops a downward trend in May, but the tilt in retail sentiment looks poised to persist despite the recent rebound in the exchange rate as traders have been net-short the pair since late January.
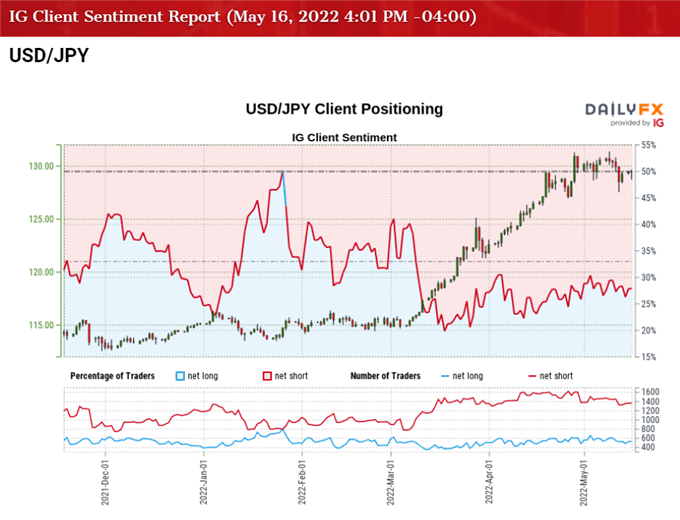
The IG Client Sentiment report shows only 26.83% of traders are currently net-long USD/JPY, with the ratio of traders short to long standing at 2.73 to 1.
The number of traders net-long is 0.73% lower than yesterday and 6.55% lower from last week, while the number of traders net-short is 8.44% higher than yesterday and 3.65% higher from last week. The decline in net-long position comes as USD/JPY extends the rebound from the monthly low (127.52), while the rise in net-short interest has fueled the crowding behavior as 27.86% of traders were net-long the pair last week.
With that said, the US Dollar may appreciate against its Japanese counterpart throughout 2022 as the FOMC normalizes monetary policy well ahead of the BoJ, but the RSI may continue to show the bullish momentum abating as it develops a downward trend even as USD/JPY traded to a fresh yearly high (131.35) earlier this month.
USD/JPY Rate Daily Chart
Source: Trading View
- USD/JPY appeared to be on track to test the April 2002 high (133.82) as a bull flag formation materialized last month, but recent price action warns of a near-term correction in the exchange rate as it fails to defend the opening range for May.
- At the same time, the Relative Strength Index (RSI) has established a downward trend as it continues to fall back from overbought territory, and lack of momentum to push back above the 129.40 (261.8% expansion) to 130.20 (100% expansion) region may lead to a break/close below the Fibonacci overlap around 126.20 (78.6% expansion) to 127.20 (23.6% retracement) if the recent series of higher highs and lows in the exchange rate unravels.
- In turn, USD/JPY may look to test the 50-Day SMA (124.97) for the first time since March, with a move below the moving average bringing the 124.50 (38.2% retracement) area on the radar.
— Written by David Song, Currency Strategist
Follow me on Twitter at @DavidJSong
[ad_2]
Source link


