
[ad_1]
WTI PRICE, CHARTS and ANALYSIS:
Recommended by Zain Vawda
How to Trade Oil
Most Read: Breaking News: CPI Miss Confirms Cooling UK Inflation, GBP on Offer
WTI FUNDAMENTAL OUTLOOK
Crude Oil faced renewed selling pressure yesterday as US inventories showed an increase of 10.507 million barrels per the American Petroleum Institute (API) report. This was coupled with a return of US dollar strength in the US session which added a further obstacle as WTI looks to regain the $80 a barrel mark.
OPEC+ meanwhile released their updated projections for 2023 yesterday with the group raising their demand forecast by 100,000bpd. The group expressed concern around the extent of China’s economic recovery and demand outlook but maintained that they expect Chinese demand to rise by 590,000bpd in 2023. The upgraded forecast did little to assist oil prices as downside pressure remained in play, with WTI posting its second successive day of losses to start the week.
Trade Smarter – Sign up for the DailyFX Newsletter
Receive timely and compelling market commentary from the DailyFX team
Subscribe to Newsletter
The US Department of Energy meanwhile announced that it would sell 26 million barrels of crude from the Strategic Petroleum Reserve (SPR) with deliveries expected to take place between April 1 and June 30. The UAE’s Energy Mister Suhail Al Mazroui said he doesn’t expect the US SPR release to shock the market. Al Mazroui stated that current prices indicate that the oil market is balanced but cautioned that OPEC+ should remain mindful of a potential economic slowdown.
Market participants will now wait for the release of the Energy and Information Administration (EIA) data on crude and crude products due out later today. EIA Crude Oil Stocks Change is forecast to come in at 1.166M with a higher number likely to weigh further on oil prices.
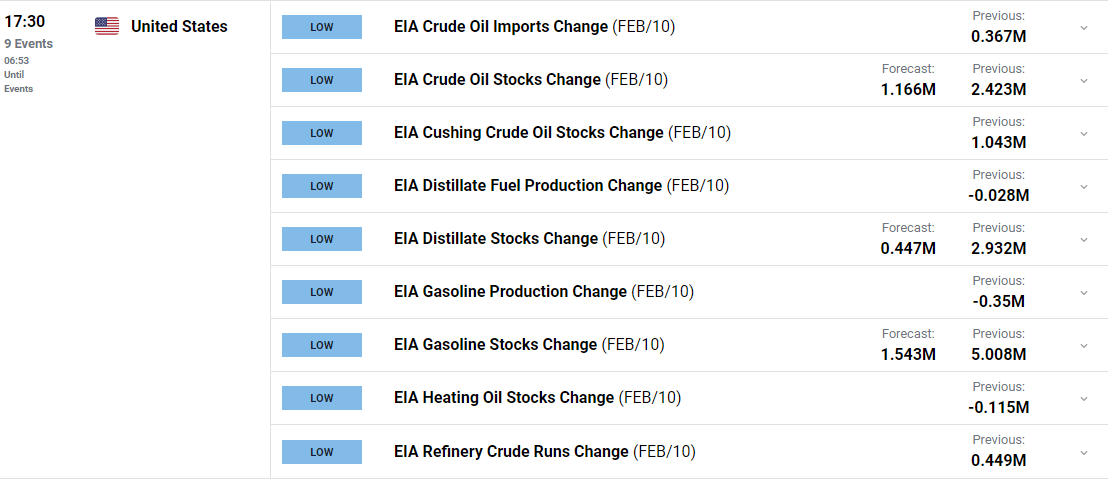
For all market-moving economic releases and events, see the DailyFX Calendar
TECHNICAL OUTLOOK
From a technical perspective, WTI is caught between the 50 and 100-day MA serving as dynamic support and resistance. Last week saw us bounce off support provided by the January 5 swing low, printing a double bottom pattern in the process. This could hint that the upside rally may continue if the 50-day MA is able to provide support. A bounce off the 50-day MA could finally see us test the 100-day MA which rests just above the $81 a barrel mark.
Alternatively, a break below the 50-day MA and support at the $77 handle could see price push toward the lows printed last week at the $73 a barrel mark. At the moment we seem to be lacking follow through as market participants seem reluctant to commit to a direction.
WTI Crude Oil Daily Chart – February 15, 2023
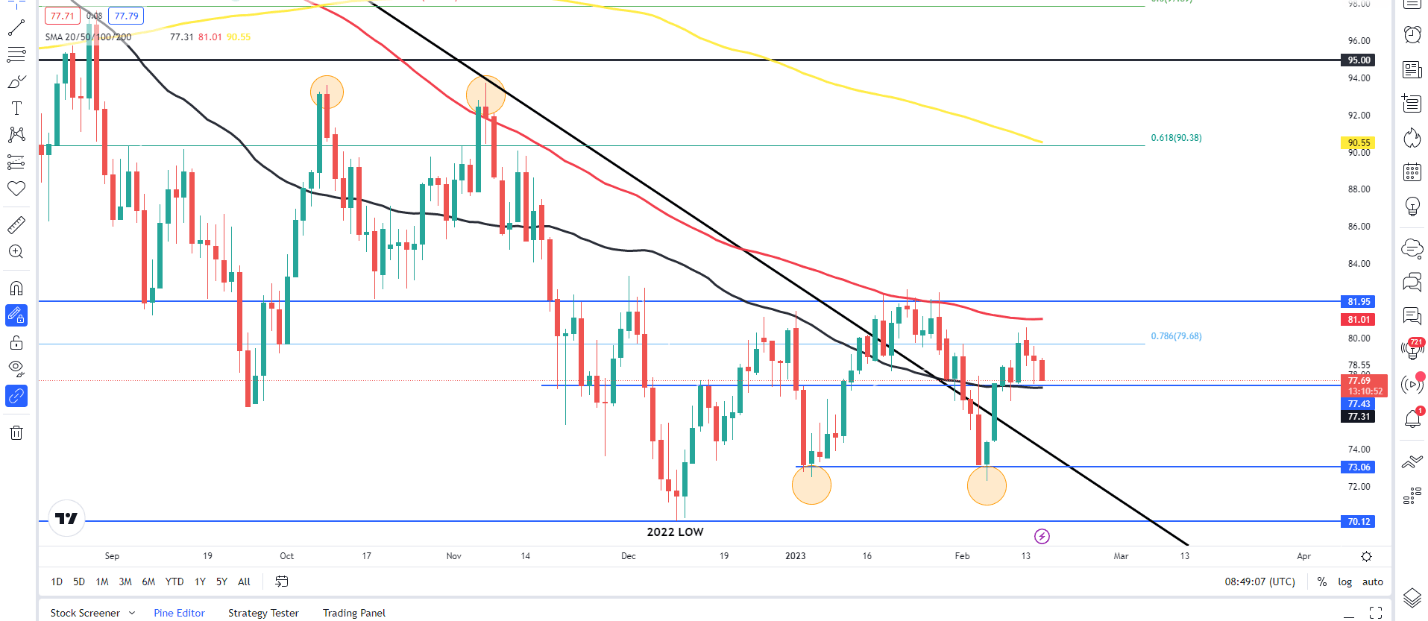
Source: TradingView
Written by: Zain Vawda, Market Writer for DailyFX.com
Contact and follow Zain on Twitter: @zvawda
[ad_2]
Source link