[ad_1]
AUDUSD, US Rates, S&P 500 Analysis and News:
- RBA Surprises With Larger Hike
- US 10Y Yield At Major Resistance
- S&P 500 Produces Hammer Candle
RBA Surprises With Larger Hike
First off, I was wrong about the RBA, while I acknowledged that the central bank had justification to raise the official cash rate in light of the sizeable increase in Q1 inflation. I did believe they would hold off for one month, on the basis that the wages data would be released until May 18th, alongside the fact that it is also an election month. On wages, the Bank noted that while various data on labour costs are yet to be released, other evidence received through their business liaison and various business surveys has indicated strong upward pressure on labour costs. That said, the RBA also surprised many including myself by opting to raise rates by 25bps in between the consensus for 15bps and the outside chance of 40bps.
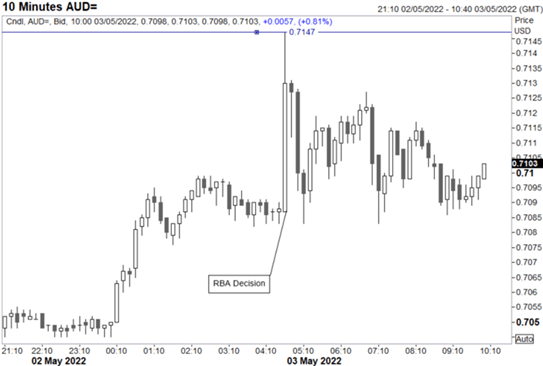
In reaction, the AUD shot higher across the board, however, gains against the USD has been short-lived with the pair back to pre-announced levels.
AUD/USD Chart: 10-Minute Time Frame
Source: Refinitiv
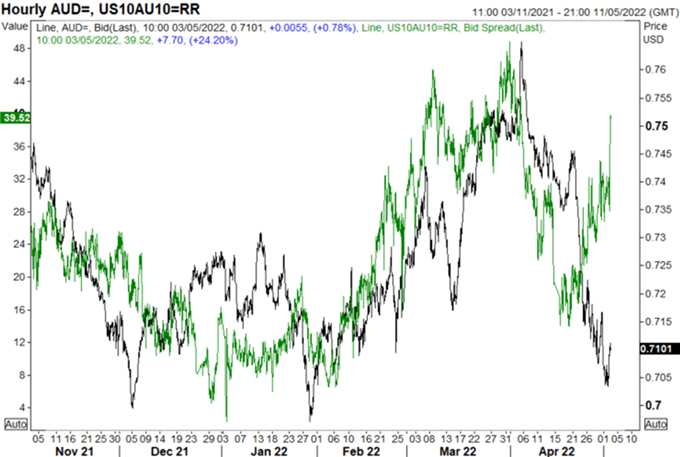
Keep in mind, risk sentiment has been a key driver for the pair, alongside market participants gearing up for tomorrow’s Fed policy decision. In turn, while rate differentials have moved in favour of the AUD over the USD, making the pair attractive, I assume many will be on the side-lines until Fed Chair Powell’s press conference where talk surrounding the Fed’s appetite of a 75bps rate hike will be closely watched.
AUD/USD vs AU/US 10Y Rate Differentials
Source: Refinitiv
US 10Y Reaches Milestone
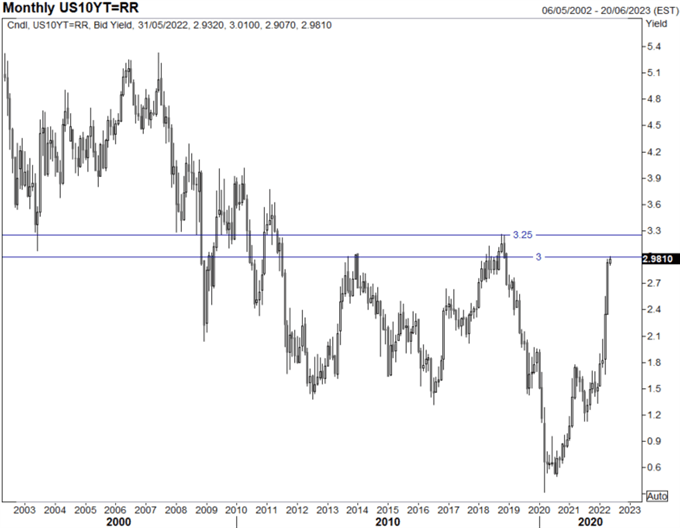
Yesterday, the US 10 year yield hit 3% for the first time since 2018. The question now is, how much further can yields go?. To me, we look to be around key resistance from around 3-3.25%, which could prompt some market players to begin increasing exposure to US treasuries.
US 10Y Yield At Major Resistance
Source: Refinitiv
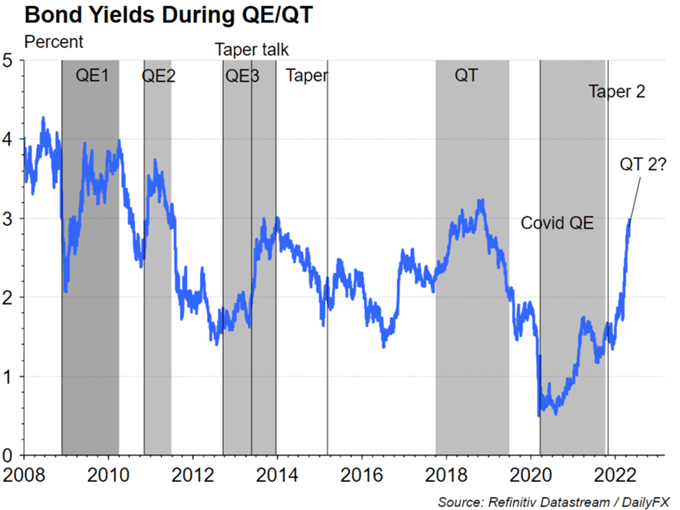
Much like when QE begins, yields start to rise, could the reverse happen when QT begins. Judging by 2017-2019 this was not initially the case. However, risk/reward is starting to look favourable for US treasuries.
S&P 500 Technically Less Bearish
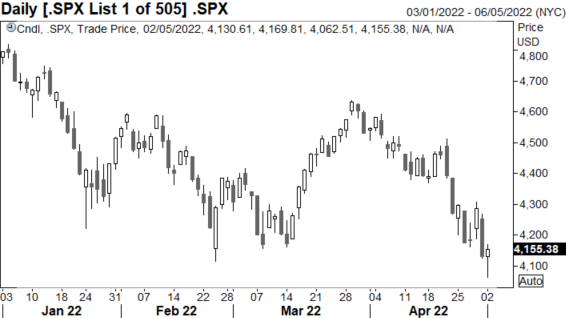
Finally, despite the S&P 500 breaking below the Feb 24th low and 4100 level. A ramp higher into the Wall Street close has created a hammer candle for the index, which is bullish from a technical standpoint. Although, I suspect traders will be reluctant to commit until Fed Chair Powell’s press conference.
S&P 500 Chart: Daily Time Frame
Source: Refinitiv
[ad_2]
Source link