
[ad_1]
Crude Oil, WTI, IEA Report, US Retail Sales, EIA Inventories – Talking Points:
- Crude oil sinks the most in 2 weeks as soft US data scares traders
- Meanwhile, an IEA report underscored 2023 global supply glut bets
- Focus shifts to EIA weekly stockpiles as WTI faces triangle pattern
Recommended by Daniel Dubrovsky
Get Your Free Oil Forecast
WTI crude oil prices fell 2.36 percent on Wednesday, marking the worst single-day drop in two weeks. The deterioration in energy prices was not an isolated event. A closer look at an intraday chart shows that oil prices fell alongside the S&P 500, which dropped the most in one month. This is as traders bought Treasuries, pushing prices up as yields came down in a flight to safety.
Risk aversion struck markets in the wake of softer-than-expected United States retail sales and wholesale inflation figures. This also caused markets to adjust monetary policy expectations. Now, Fed Funds Futures have almost fully priced out 2 rate hikes this year in favor of just a 25-basis point increase. Then, rate reductions are seen later in 2023. This continues to diverge from policymakers’ projections.
Focusing on oil-specific news, the International Energy Agency (IEA) released its latest report on the energy market. The IEA noted that the global oil supply could exceed consumption by about 1 million barrels per day in the first quarter. This is despite an anticipated demand revival from China, which is increasingly opening from lockdowns.
Looking at the remaining 24 hours, WTI will be eyeing the next inventory report from the Energy Information Administration (EIA). Oil stockpiles are seen shrinking by 13.21 million barrels in the previous week. That contrasts with a report by the American Petroleum Institute (API) that is looking at a buildup of 7.6 million barrels. An outcome towards the latter risks inducing further downside for oil.
Crude Oil Technical Analysis – Daily Chart
On the daily chart, WTI appears to be trading within the boundaries of an Ascending Triangle chart formation. This is typically a bearish pattern that may open the door to resuming the downtrend which preceded the triangle. Prices recently rejected the ceiling around 81.93, opening the door to a retest of the rising floor from December.
Recommended by Daniel Dubrovsky
How to Trade Oil
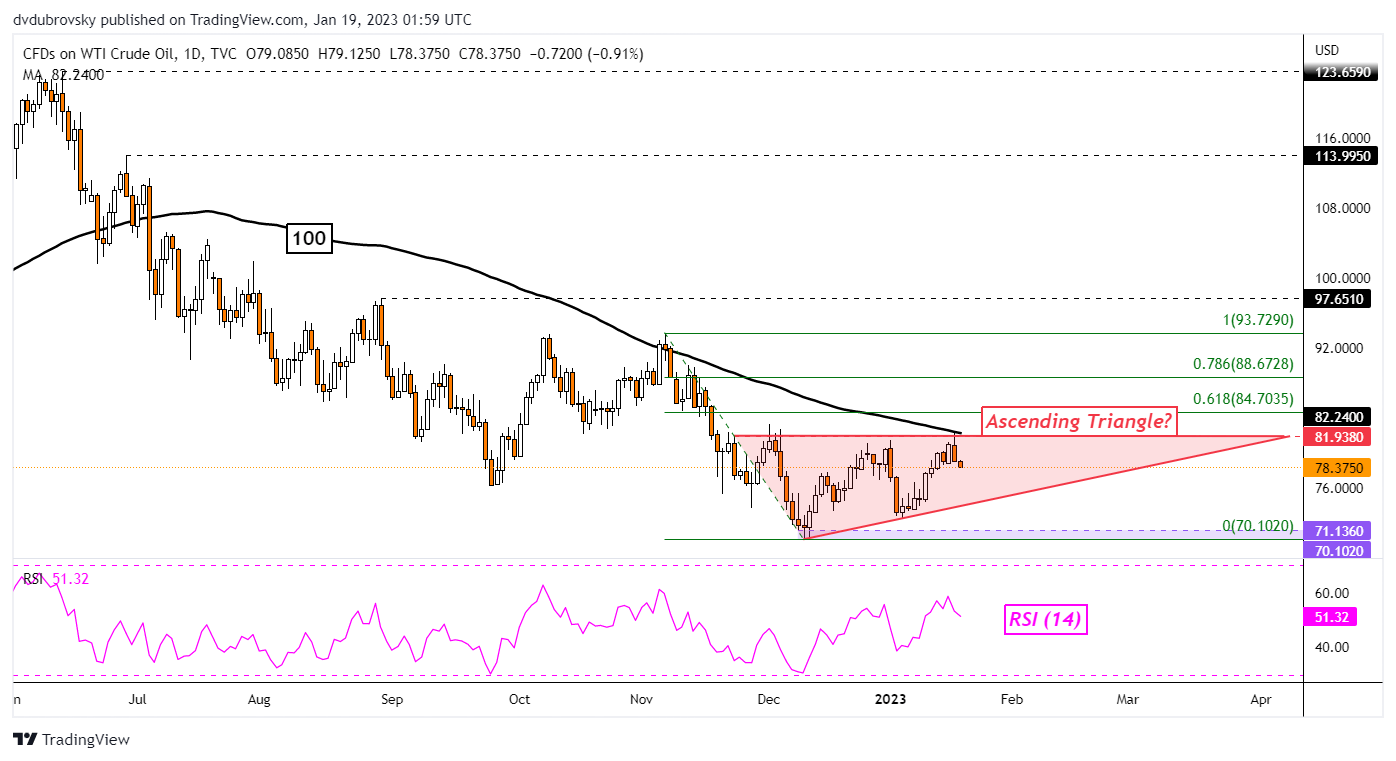
Chart Created Using TradingView
— Written by Daniel Dubrovsky, Senior Strategist for DailyFX.com
To contact Daniel, follow him on Twitter:@ddubrovskyFX
[ad_2]
Source link