
[ad_1]
Dow Jones, S&P 500, Retail Trader Positioning, Technical Analysis – IGCS Equities Update
- Dow Jones and S&P 500 remain vulnerable to elevated volatility
- Retail traders have increased their upside exposure in recent days
- From a contrarian standpoint, this may hint at more trouble ahead
Recommended by Daniel Dubrovsky
Get Your Free Equities Forecast
Following the collapse of Silicon Valley Bank last week and recent troubles at Credit Suisse, volatility has been permeating throughout Wall Street. In response, retail traders have actually increased upside exposure in the Dow Jones and S&P 500. This can be seen by looking at IG Client Sentiment (IGCS). IGCS tends to function as a contrarian indicator. Could this mean further pain is in store for equities?
Dow Jones Sentiment Outlook – Bearish
According to IGCS, about 64% of retail traders are net-long the Dow Jones. Since most of them are net-long, this hints prices may continue falling. This is as upside exposure increased by 14.64% and 15.14% compared to yesterday and last week, respectively. With that in mind, the combination of current positioning and recent changes is offering a stronger bearish contrarian trading bias.

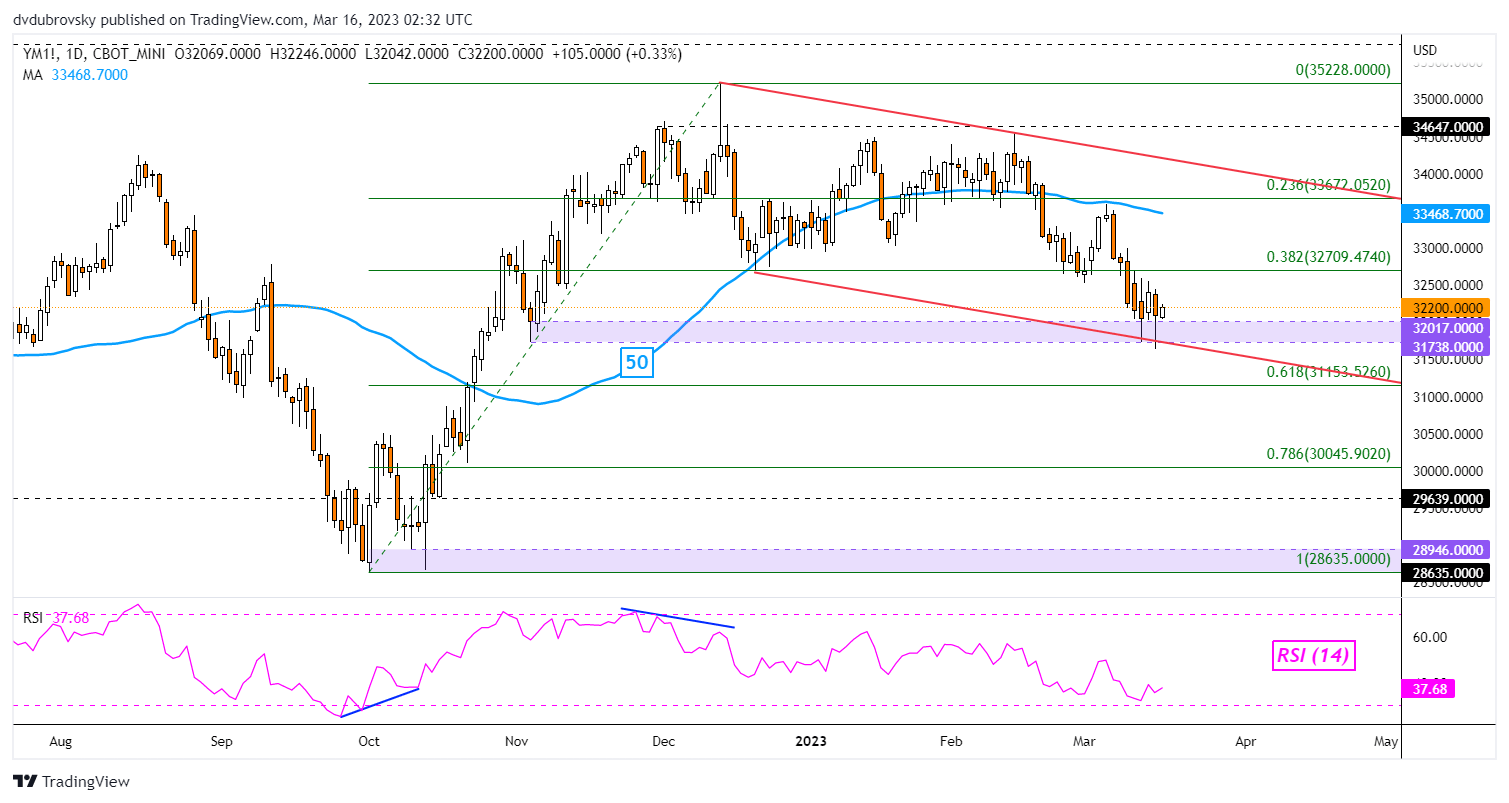
Dow Jones Technical Analysis
The Dow Jones is hovering above the key 31738 – 32017 support zone, established back in November. This is as prices face the floor of a falling channel from December. As such, this could end up being a near-term pivotal technical point, opening the door to a turn higher toward the 50-day Simple Moving Average (SMA). Otherwise, clearing support exposes the 61.8% Fibonacci retracement level at 31153.
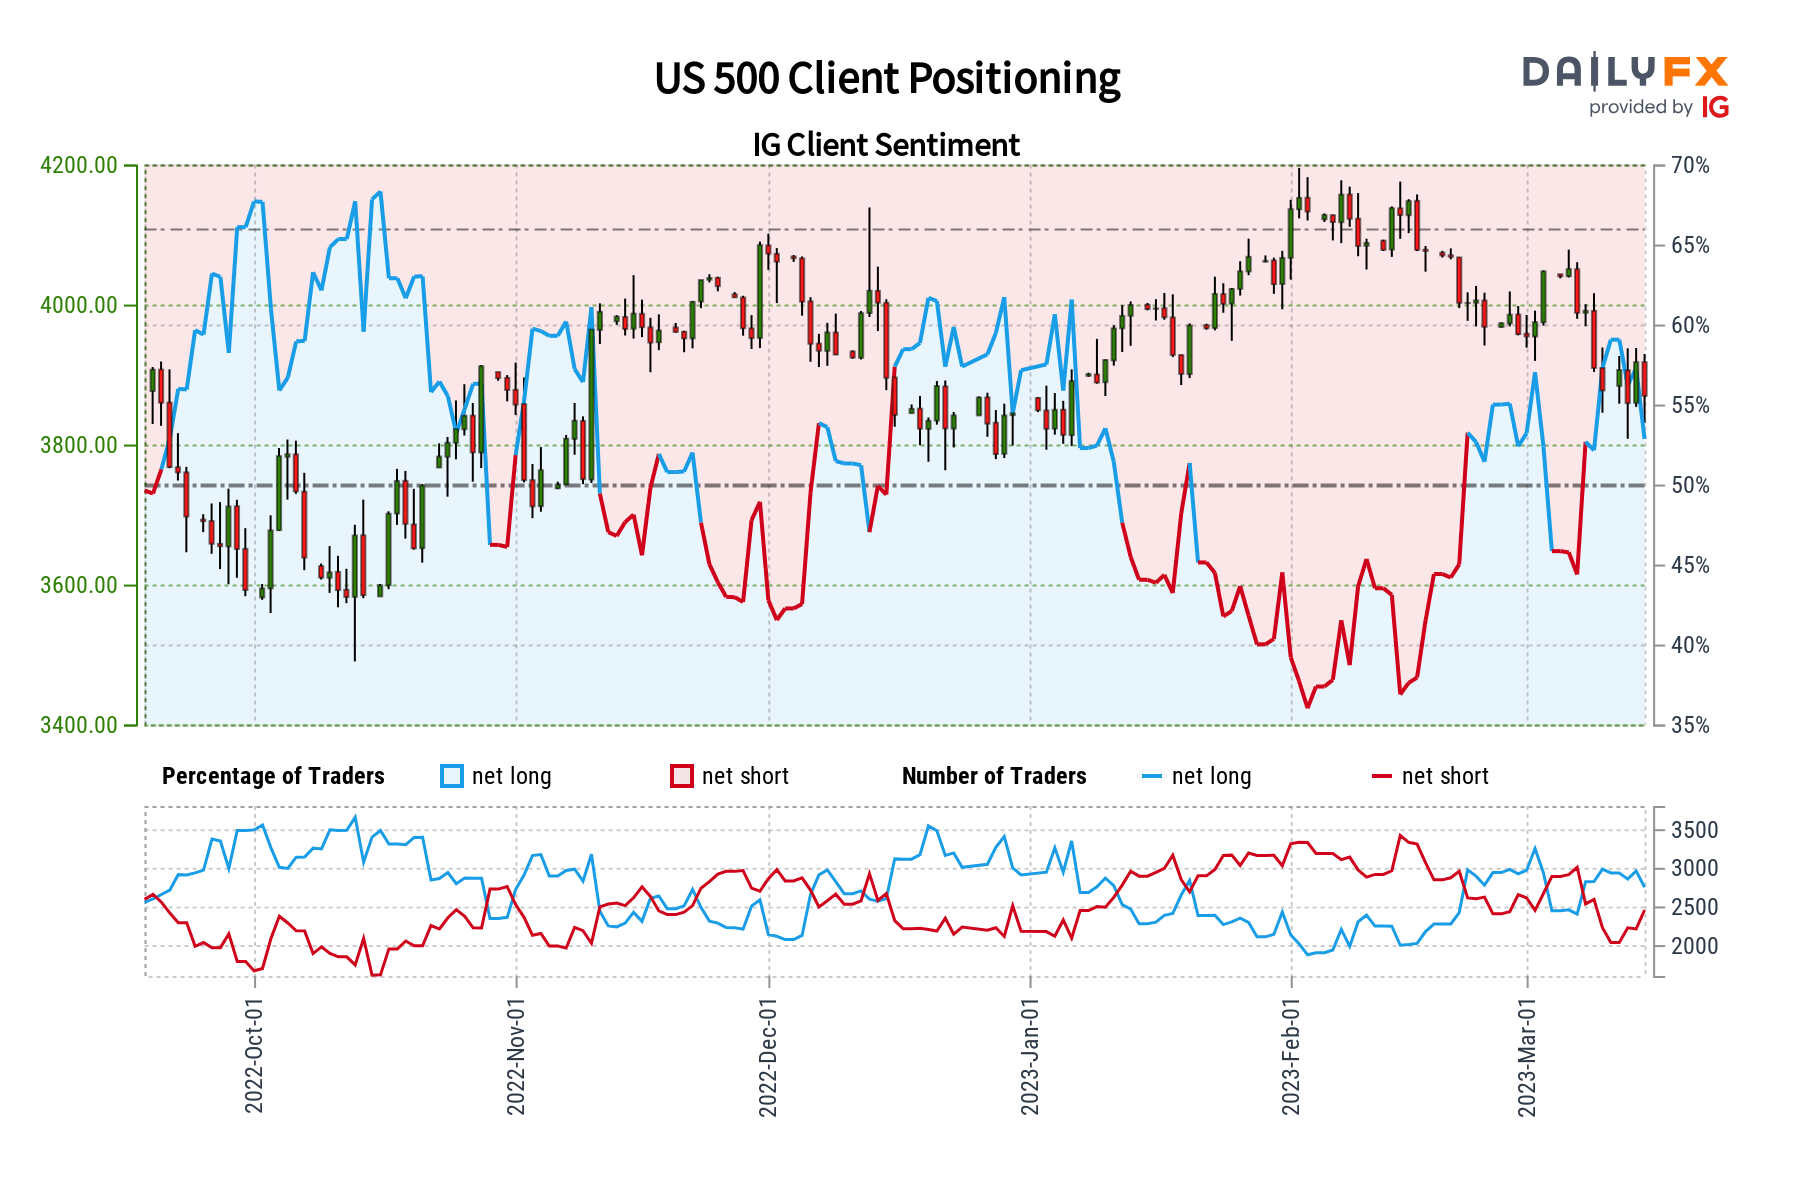
S&P 500 Sentiment Outlook – Bearish
According to IGCS, about 58% of retail traders are net-long the S&P 500. Since most traders are net-long the S&P, this hints prices may continue falling. This is as upside exposure increased by 8.91% and 7.84% compared to yesterday and last week, respectively. With that in mind, the combination of overall positioning and recent changes is offering a stronger bearish contrarian trading bias.
Recommended by Daniel Dubrovsky
Improve your trading with IG Client Sentiment Data
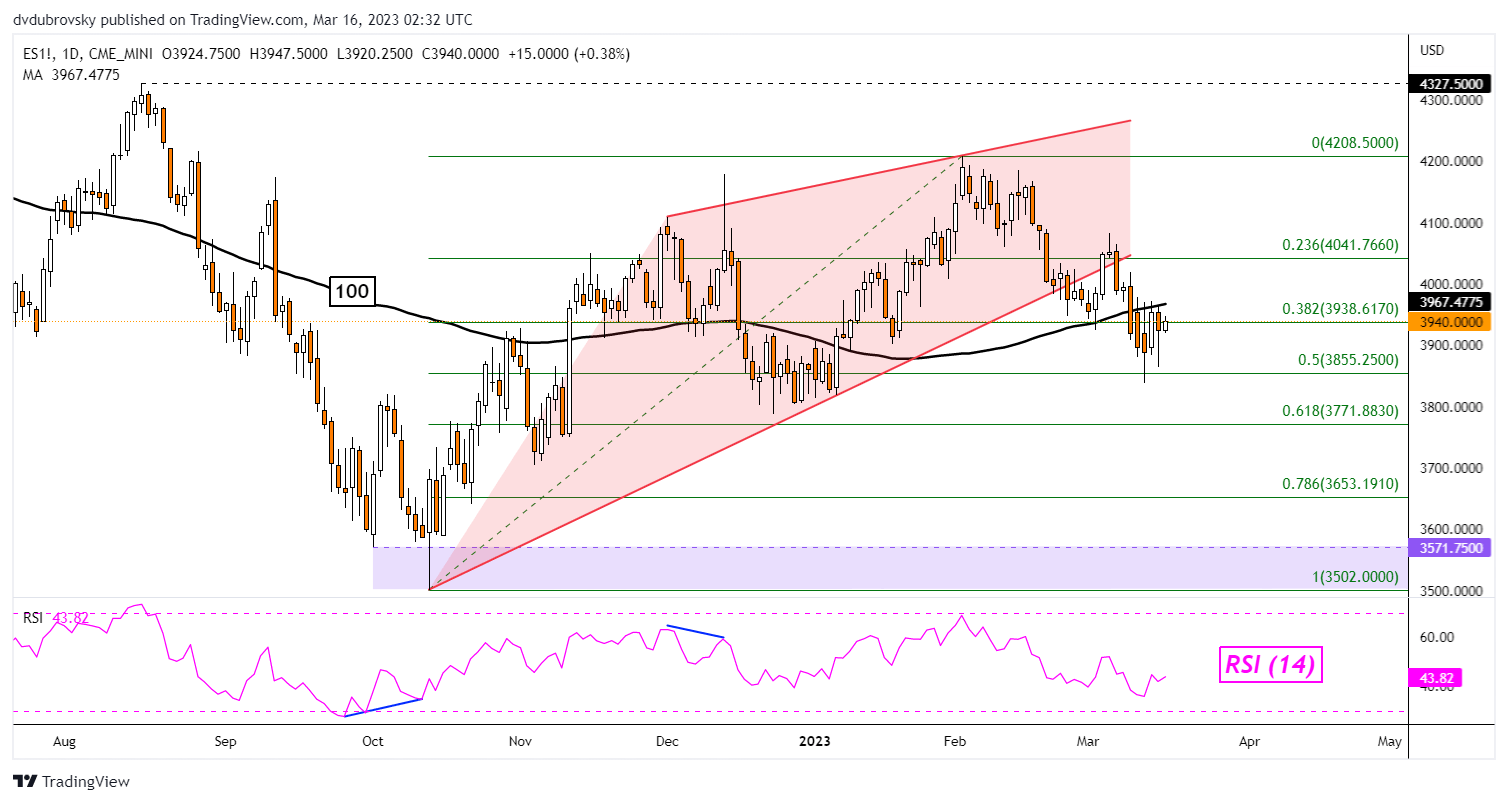
S&P 500 Technical Analysis
The S&P 500 is also hovering above support. Prices were unable to clear the midpoint of the Fibonacci retracement level at 3855.25. Immediate resistance is the 100-day SMA. Clearing higher would open the door to extending gains towards the 23.6% level at 4041 before targeting the January high. Still, the broader technical bias remains bearish given the breakout under a Rising Wedge in late February. Clearing support exposes the 61.8% point at 3771 towards the October low.
— Written by Daniel Dubrovsky, Senior Strategist for DailyFX.com
To contact Daniel, follow him on Twitter:@ddubrovskyFX
[ad_2]
Source link