
[ad_1]
GBP/USD Prices, Charts, and Analysis
- GBP/USD has again failed to hang on to gains
- The UK unit gained with others following the release of Fed minutes
- Technically, the Pound has slipped below a medium-term trendline
Recommended by David Cottle
Traits of Successful Traders
The British Pound has joined many other currencies in gaining a little on the United States Dollar on Thursday, as European and Asian investors pore over the latest commentary from the US Federal Reserve, however, in Sterling’s case those gains once again proved short-lived.
The minutes of May’s Federal Open Market Committee meeting were released on Tuesday and indicated perhaps that rate-setters may now be inclined to wait and assess the impact of previous rises in the cost of borrowing before unleashing more. This was hardly an emphatic rejection of higher rates, but it was enough to see the Dollar wobble a little, especially as investors are nervously eyeing more-than-usually tortured negotiations over the Federal debt ceiling as well.
Meanwhile, the Pound remains under a cloud as far as sentiment is concerned. The British currency has risen quite sharply since September of 2022, on (well-founded) expectations that local rates had further to rise. Now it seems investors are running out of reasons to buy, with the Pound struggling to maintain any momentum even in the face of still-high inflation and the clear prospect of yet-higher interest rates from the Bank of England.
While the United Kingdom’s economy does seem to be bettering forecasts, a lot of those forecasts were extremely gloomy in the first place. It’s also struggling with some of the highest inflation in Europe when essentials such as food and fuel are taken into account, and government borrowing has risen sharply.
Wednesday’s session brought news that official US growth figures for the first quarter of this year had been revised higher. Annualized growth is now estimated to have been 1.3%, still feeble but better than the 1.1% initially reported. This was enough to see GBP/USD slip back into the red for the day.
The near-term focus will be on US inflation numbers and official UK retail figures, both of which are due on Friday.
GBP/USD Technical Analysis
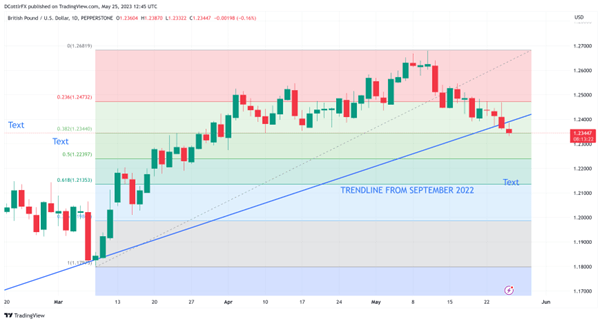
Chart Compiled Using TradingView
Trade Smarter – Sign up for the DailyFX Newsletter
Receive timely and compelling market commentary from the DailyFX team
Subscribe to Newsletter
The last couple of sessions have seen things turn quite sour for sterling and, although GBP/USD remains well-up for the year, it has now crossed below a trend line which had previously been in place, if seldom tested, on the daily chart since September 2022.
If bulls can’t get the pound back above this in short order, and ideally by week’s end, then it could well be a bearish longer-term signal for the pair.
However, for now, the Pound seems to be drifting down toward support at 1.23440. That’s the second Fibonacci retracement of the rise from the lows of March 23 to the intraday peak of May 10, a thirteen-month high.
While that prop has already given way on an intraday basis, the current down-move has yet to see a daily close below it, so keep an eye on the level through Thursday’s US session. Bulls will need to regain both that trendline resistance, now at 1.23878, then perhaps first-retracement resistance at 1.24732 if they’re going to stage a convincing reversal.
IG’s own sentiment data would suggest that that’s quite unlikely. However, with fully 77% now bearish on GBP/USD, some contrarian retracement could be sterling’s best near-term hope.
–By David Cottle for DailyFX
[ad_2]
Source link