
[ad_1]
Gold, Silver, Retail Trader Positioning, Technical Analysis – IGCS Commodities Update
- Gold and silver prices have been rising following SVB’s collapse
- Retail traders responded by boosting their downside exposure
- Is this a sign that more upside could be in store for XAU & XAG?
Recommended by Daniel Dubrovsky
Get Your Free Gold Forecast
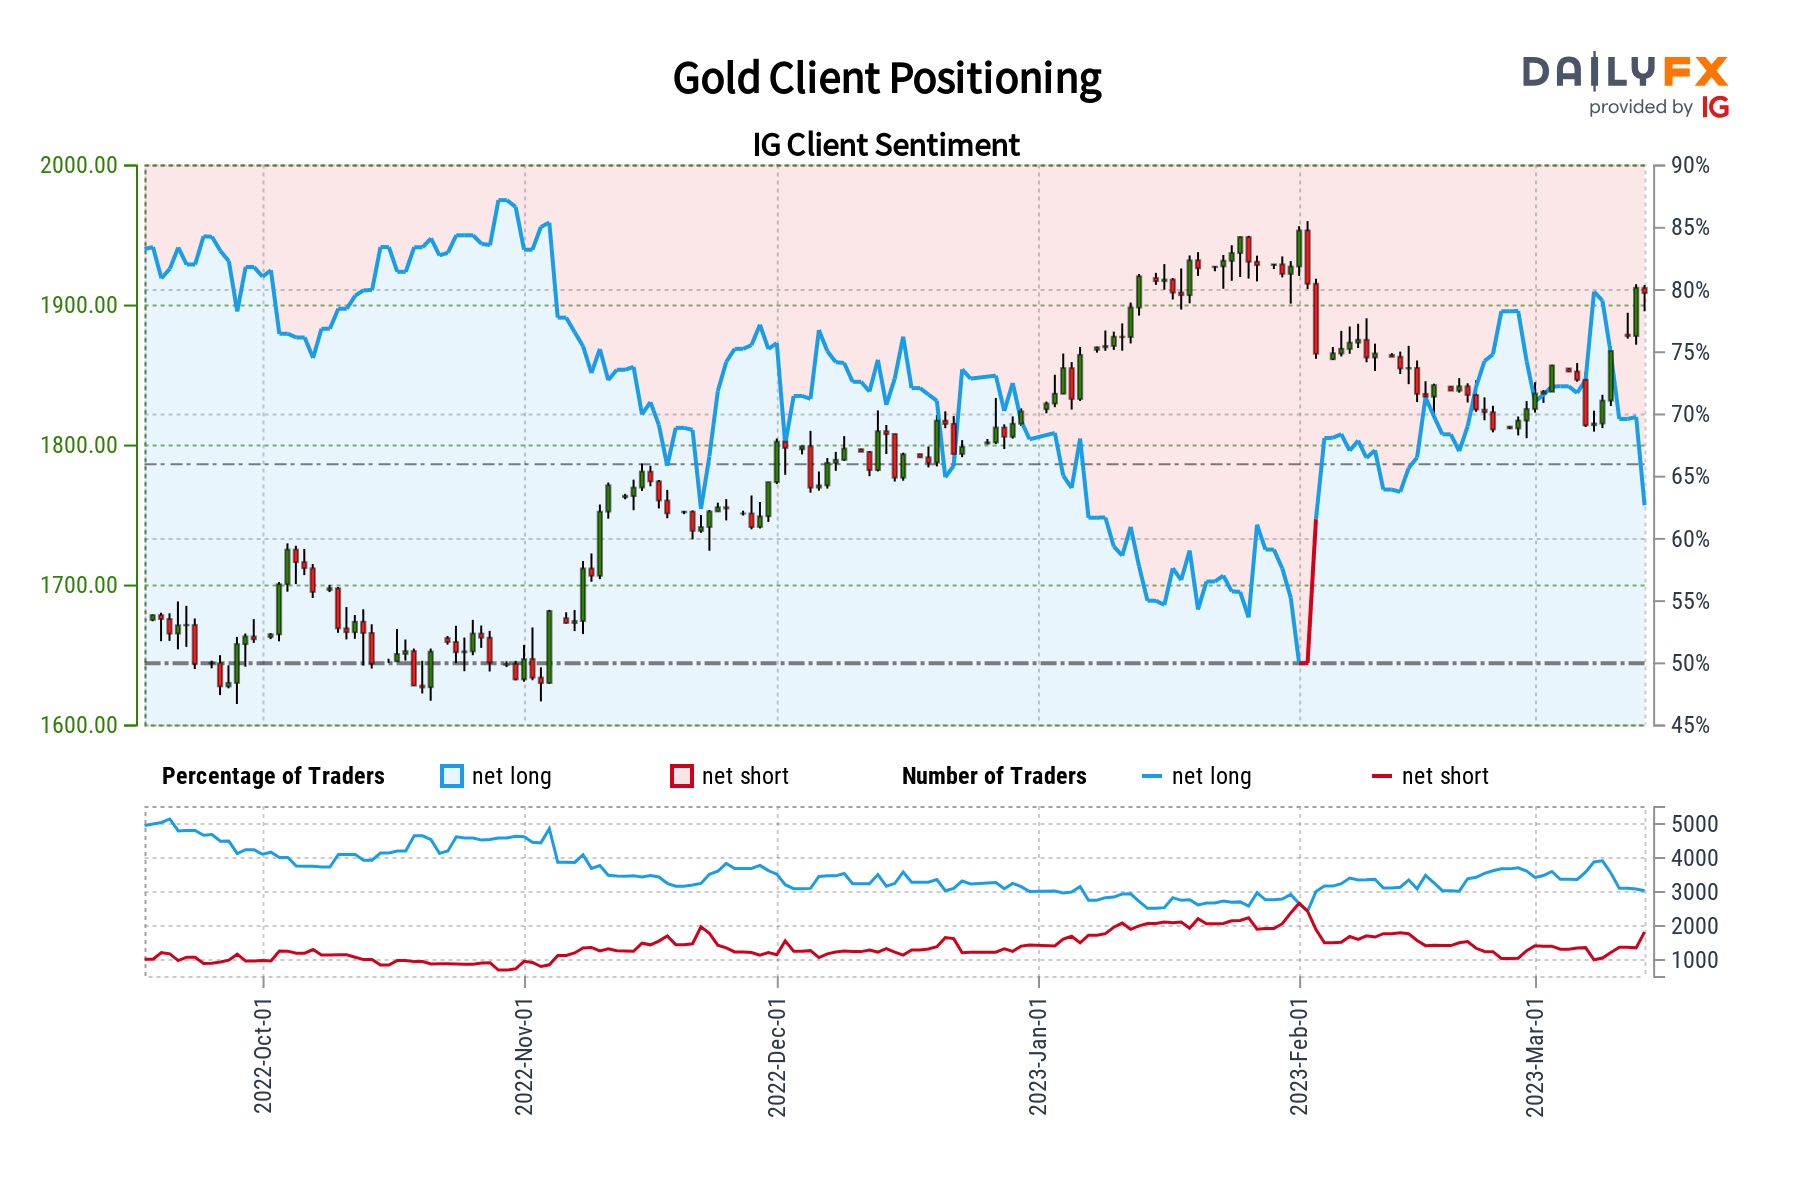
In the wake of last week’s collapse of Silicon Valley Bank, gold and silver prices have soared as Treasury yields declined. Retail traders have responded by increasing downside bets in XAU/USD and XAG/USD. This can be seen by looking at IG Client Sentiment (IGCS). IGCS tends to function as a contrarian indicator. With that in mind, if retail traders continue boosting bearish bets, could gold and silver see further upside?
Gold Sentiment Outlook – Bullish
The IGCS gauge shows that about 60% of retail traders are net-long gold. Since most of them are net-long, this hints prices may continue falling. But, downside exposure has increased by 7.85% and 92% compared to yesterday and last week, respectively. With that in mind, recent shifts in positioning hint that the price trend may soon reverse higher.
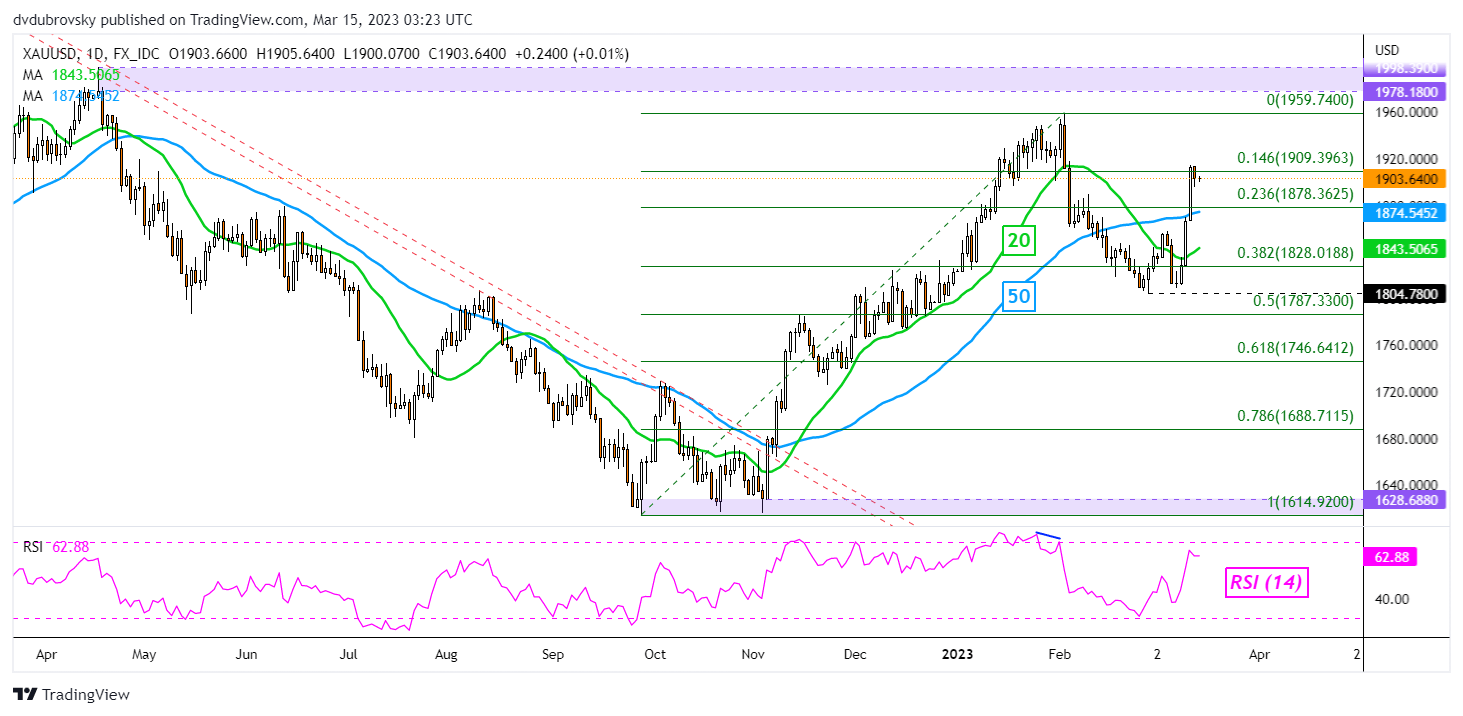
XAU/USD Daily Chart
On the daily chart, gold confirmed a breakout above the 50-day Simple Moving Average (SMA) as well as the 20-day equivalent. This is offering an increasingly neutral setting. There is now the potential for a bullish Golden Cross to form in the days ahead. Immediate resistance seems to be the minor 14.6% Fibonacci retracement level at 1909. Confirming a breakout above that price exposes the February peak at 1959.74. Pushing under 1804 could reinstate a more bearish bias.
Recommended by Daniel Dubrovsky
How to Trade Gold
Silver Sentiment Outlook – Bullish
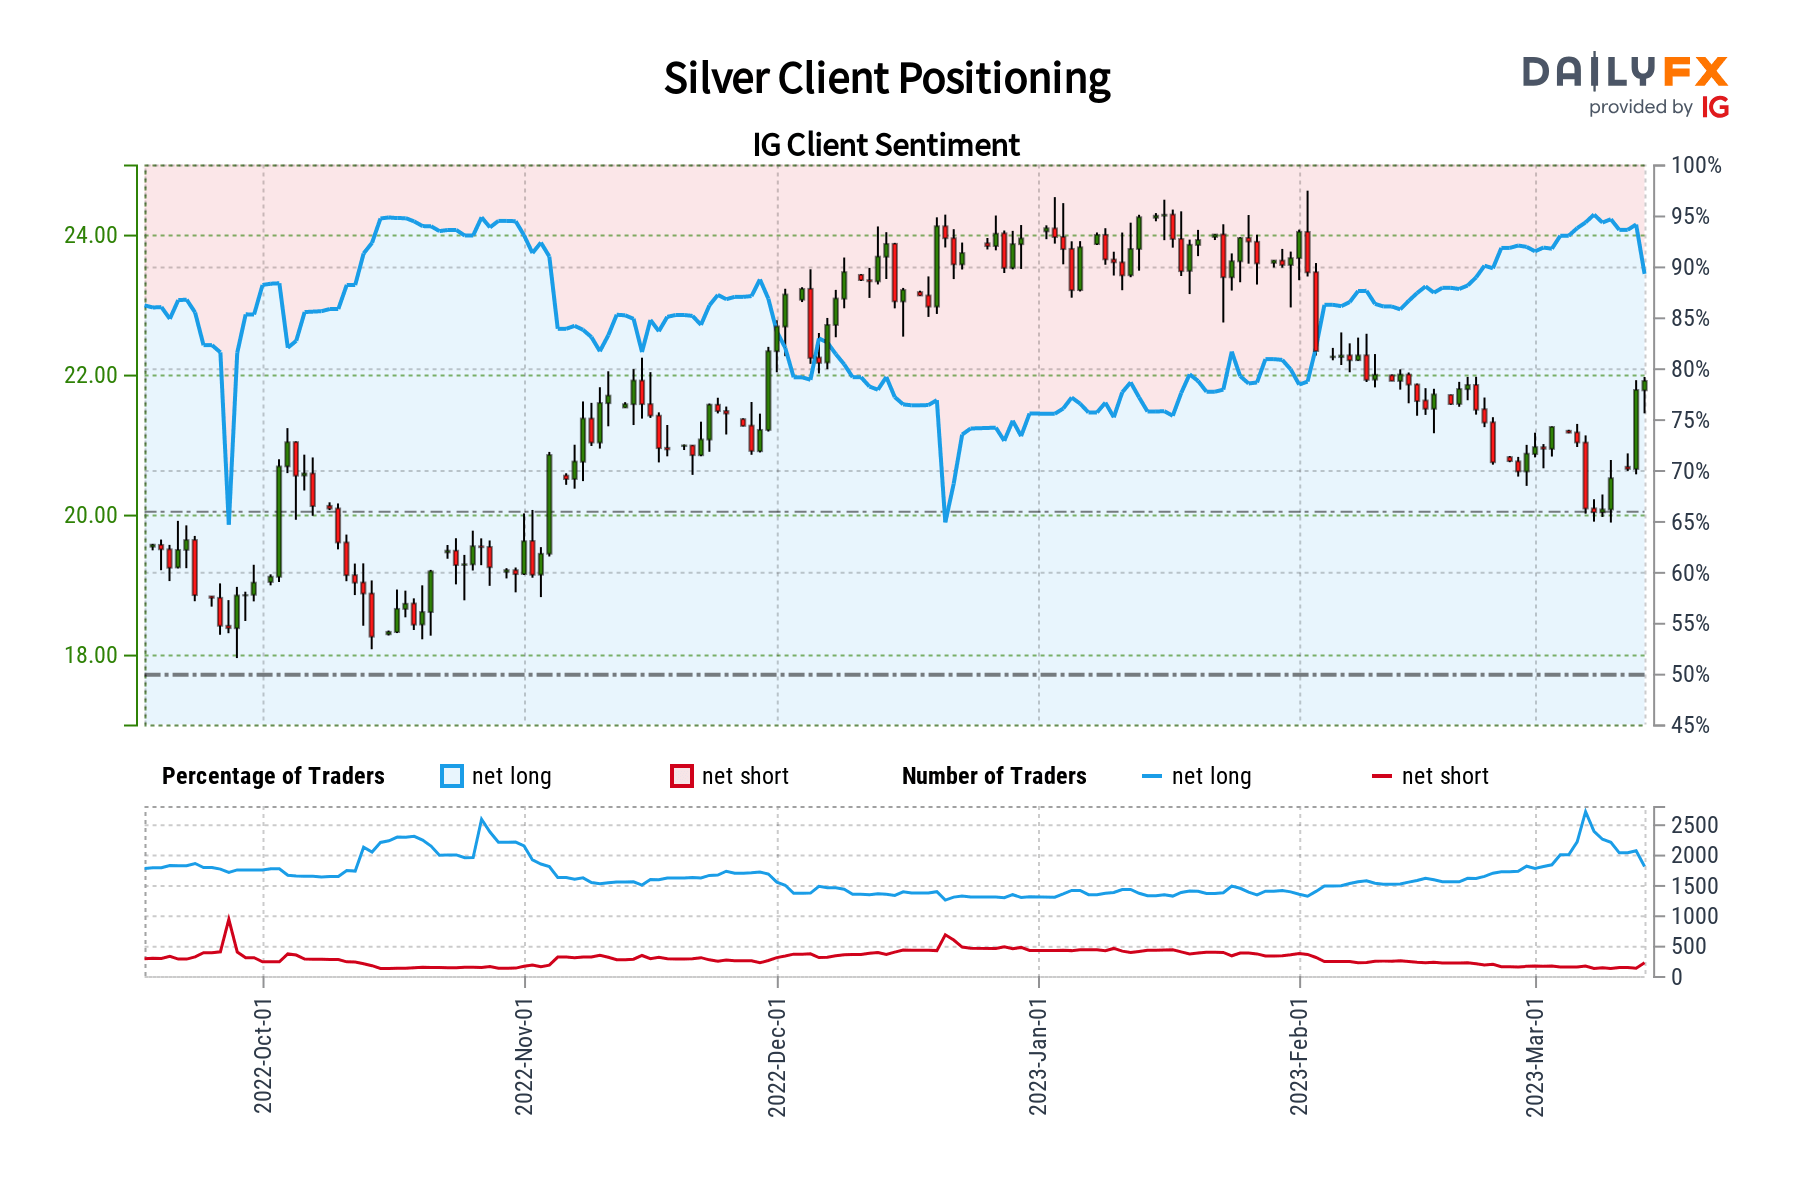
The IGCS gauge reveals that about 88% of retail traders are net-long silver. Since most of them are still biased higher, this hints prices may continue falling. But, downside exposure has increased by 2.71% and 62.14% compared to yesterday and last week, respectively. With that in mind, recent shifts in exposure hint that the price trend may soon reverse higher.
Recommended by Daniel Dubrovsky
Improve your trading with IG Client Sentiment Data
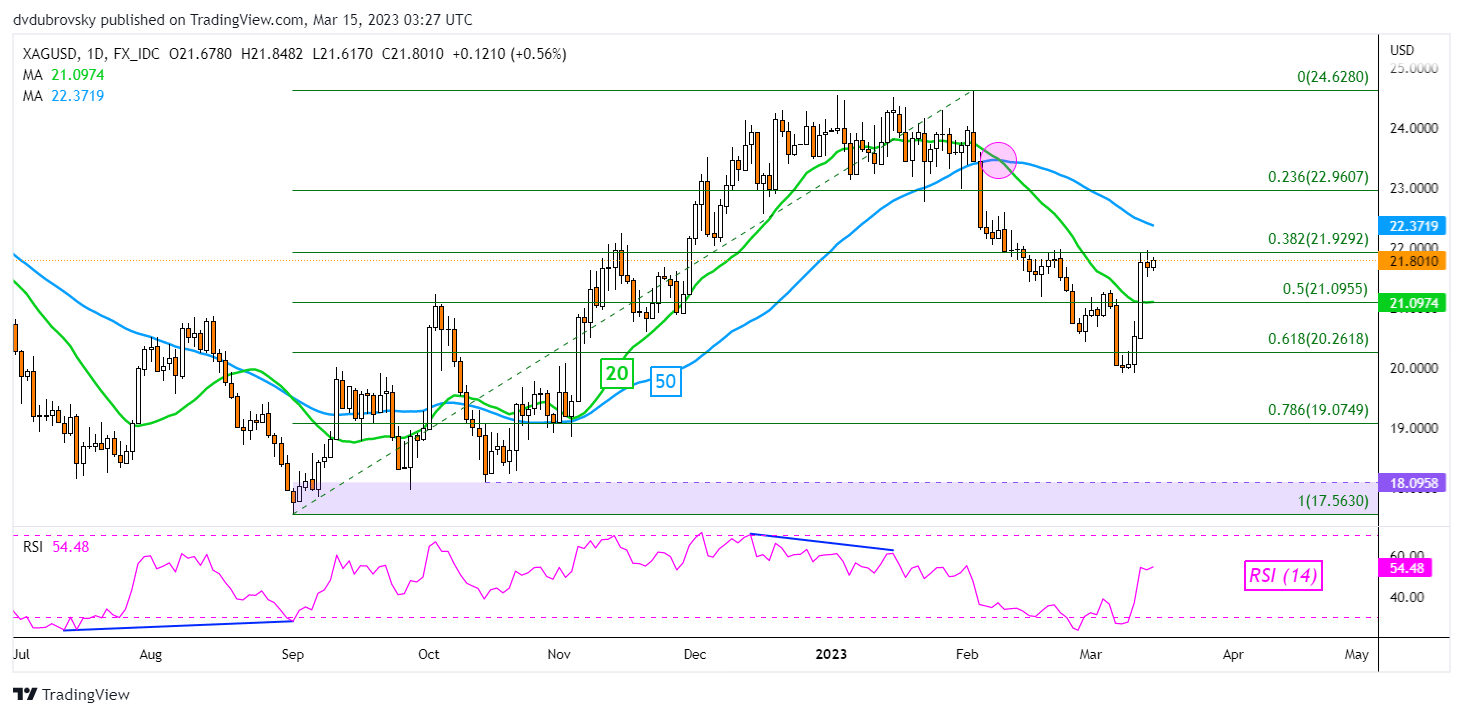
XAG/USD Daily Chart
Unlike gold, silver prices have only confirmed a breakout above the 20-day SMA, with the 50-day line still standing above. As well as that line, another key point of immediate resistance is the 38.2% Fibonacci retracement level at 21.92. Confirming a breakout above these 2 points could offer an increasingly near-term bullish trajectory, placing the focus on January peaks. Otherwise, downtrend resumption entails pushing under the early March low.
— Written by Daniel Dubrovsky, Senior Strategist for DailyFX.com
To contact Daniel, follow him on Twitter:@ddubrovskyFX
[ad_2]
Source link