
[ad_1]
Gold, Silver, Trendlines, Symmetrical Triangle – Technical Update:
- Gold prices remain focused lower as resistance holds
- Silver faces key rising support since September 2022
- What are key technical levels to watch going forward?
Recommended by Daniel Dubrovsky
Get Your Free Gold Forecast
XAU/USD Analysis
Gold prices have been aiming cautiously lower in recent days, extending the broader decline since May. Guiding the yellow metal lower has been a falling trendline from May. Recently, XAU/USD rejected the former rising support line from November as it intersected with the descending trendline, opening the door to a downward resumption.
Now, the yellow metal is facing the 38.2% Fibonacci retracement level of 1903.46 as immediate support. Breaking lower would expose the August swing low of 1884. Clearing under the latter opens the door to downtrend resumption, exposing the midpoint of the Fibonacci retracement level of 1848.37. Otherwise, turning higher places the focus on the 1936.90 inflection point.
Recommended by Daniel Dubrovsky
How to Trade Gold
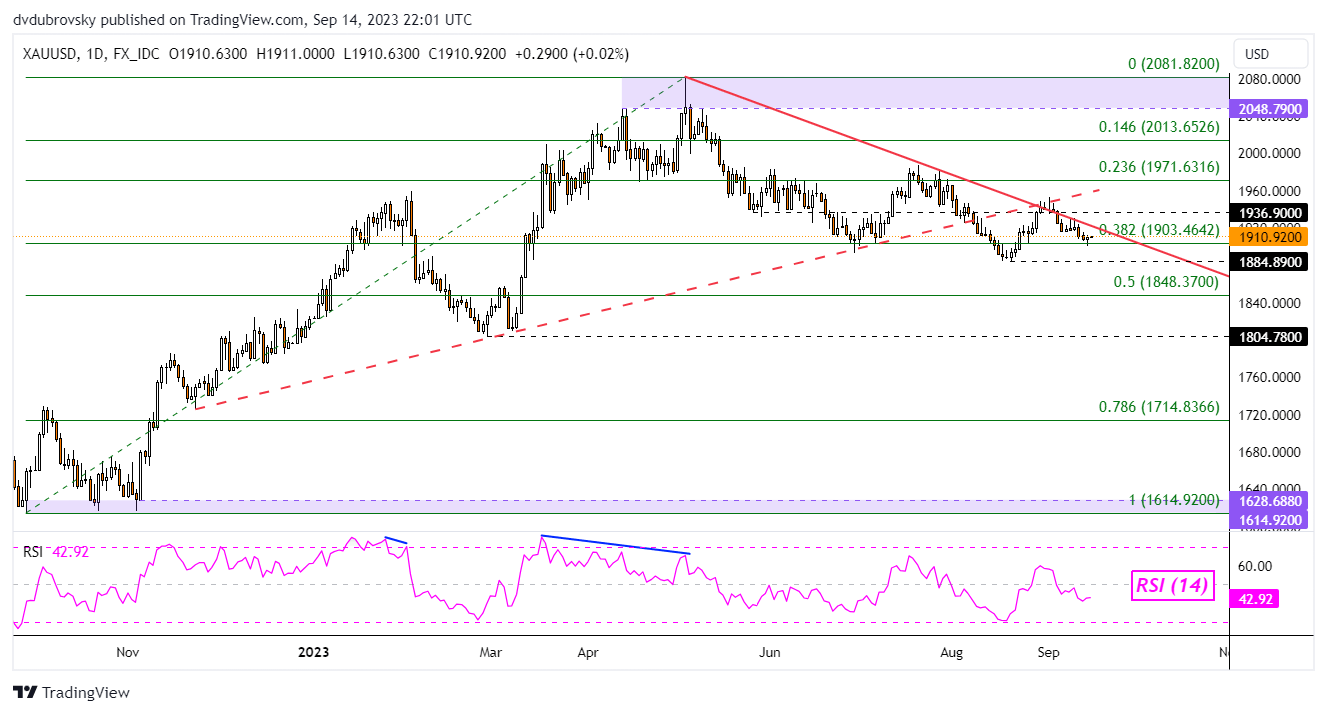
Chart Created in TradingView
XAG/USD Analysis
Meanwhile, things are also looking interesting for Silver. After a series of more pronounced losses compared to gold, XAG/USD now finds itself testing a rising range of support from September 2022. This zone is also closely aligned with the 61.8% Fibonacci retracement level of 22.29. Given this key support juncture, a bounce higher is possible.
That would open the door to extending consolidation since March. Immediate resistance is the midpoint of the Fibonacci retracement at 23.02. Pushing higher would subsequently expose the falling zone of resistance from April. If the latter holds, silver may prolong its broadly neutral technical bias. Otherwise, clearing support exposes the 78.6% level at 21.24.
| Change in | Longs | Shorts | OI |
| Daily | 6% | -9% | 5% |
| Weekly | 17% | -36% | 10% |
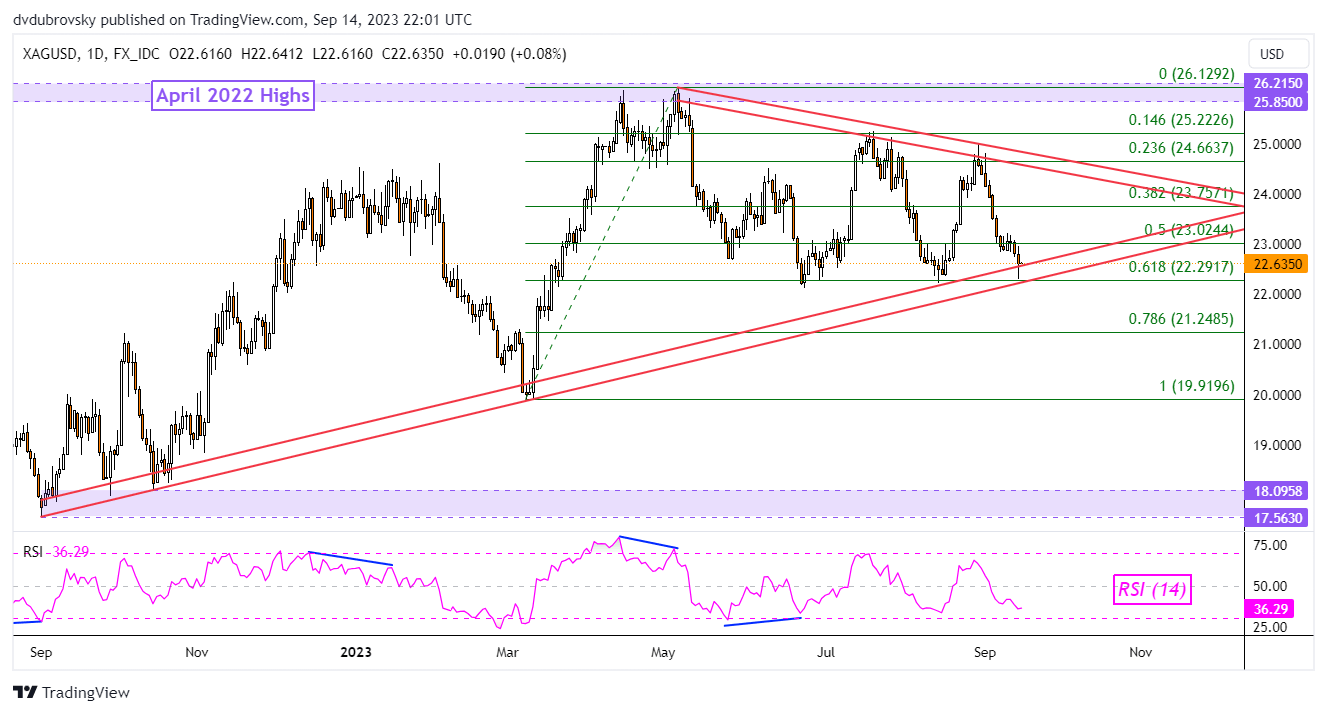
Chart Created in TradingView
— Written by Daniel Dubrovsky, Strategist for DailyFX.com
[ad_2]
Source link