
[ad_1]
Japanese Yen Talking Points:
Recommended by James Stanley
Get Your Free JPY Forecast
Trends are important things in markets because it can help with biasing directional moves. While the future will remain uncertain, trends populate often and there’s usually a good reason for doing so. In the FX market, that rationale often revolves around a Central Bank, or at least the expectations around a Central Bank and that’s what describes the USD/JPY story over the past couple of years.
As US rates lifted on the back of the Fed hiking rates in effort of tackling inflation, the Bank of Japan held rates flat and policy loose. But, with time the inflation issue began showing in Japan and at this point the economy is facing its highest levels of inflation in 40 years. CPI has been holding inside of 4% so it’s not as dire of a situation as we’ve seen in Europe or the UK or even the US, but all of those problems started out similarly with inflation creeping above target and before we knew it, inflation was a problem again.
Markets have begun to anticipate some element of change on the back of that fact but there’s also another item of interest and that’s the potential leadership change that’s expected atop the BoJ in a couple of months. Current BoJ Governor Kuroda is noted for being extremely dovish and given the issue with inflation, it’s logical to expect that his successor may not be as loose leaning with policy parameters.
This premise has been strengthened by the policy review that the Bank of Japan performed in December. That led to a sharp move of Yen-strength as markets read that as a sign of possible change in the not-too-distant future.
Since then, the trend has been decisively bullish for the Japanese Yen and the move that had built for 21 months from the 2021 open and through the first three quarters of 2022 continues to unwind.
USD/JPY Weekly Chart
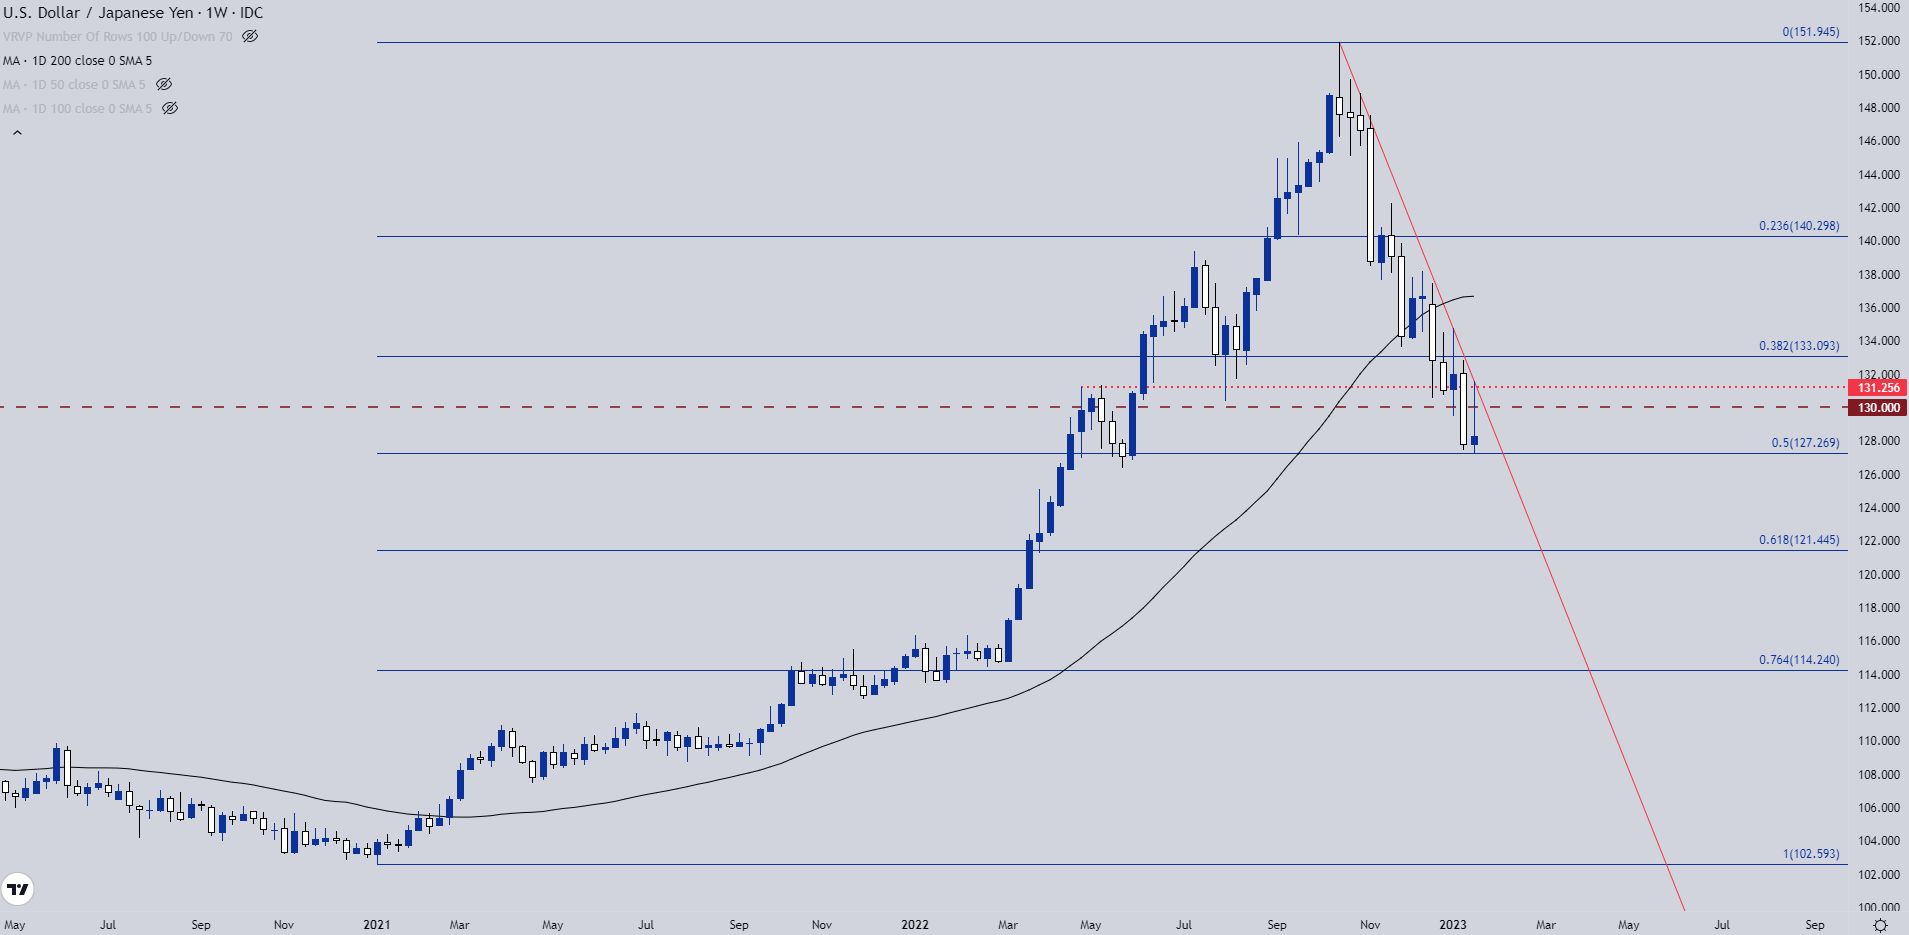
Chart prepared by James Stanley; USD/JPY on Tradingview
Last Night’s BoJ
At last night’s rate decision markets were anticipating a possible tweak that might illustrate a larger change from the bank. That didn’t happen, and instead a relief rally showed as USD/JPY shorts quickly covered, sending the pair jumping back-above the 130 handle, albeit temporarily. The day’s high ended up printing at a familiar spot, the same 131.25 level that set a double top in May of last year before becoming support in December after the policy review was announced from the Bank of Japan.
Support is also holding at a key spot, taken from the 50% mark derived from the Fibonacci retracement drawn from the 2021-2022 major move. This plots at 127.27 and marks the current six-month-low in the pair.
USD/JPY Daily Chart
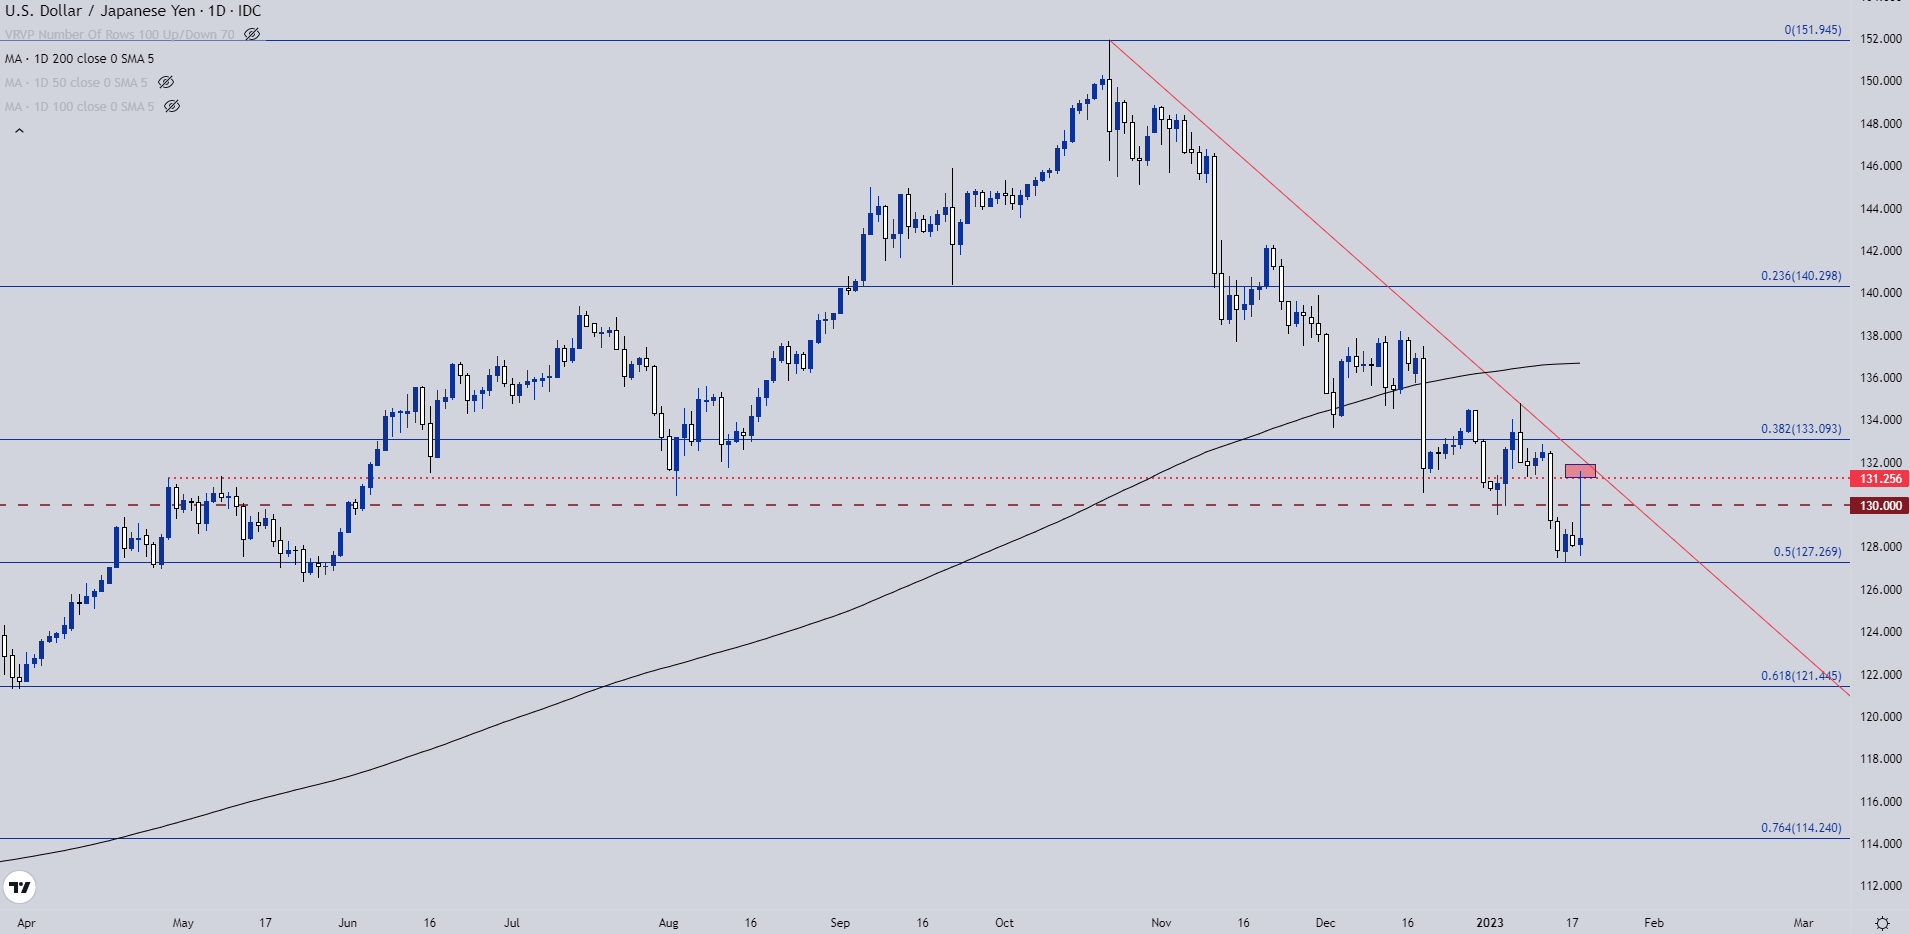
Chart prepared by James Stanley; USD/JPY on Tradingview
USD/JPY Shorter-Term
Going down to the four-hour chart and we can get more granular with the downtrend. I’ve also added a 20-day moving average here in blue, helping to illustrate the short-term trending nature of the scenario inside of the longer-term setup.
Last night’s high hit that 20 day moving average and sellers pushed prices right back down towards the lows but, as yet, haven’t been able to re-test the Fibonacci level at 127.27. This opens the door for more pullback which can keep 130 and 131.25 as actionable resistance areas.
The trend has turned in USD/JPY and last night doesn’t seem to be something that would bring a big picture reversal. And if that’s the case, sellers can wait for bounces in the pair in the effort of finding and executing on lower-high resistance.
Recommended by James Stanley
How to Trade USD/JPY
USD/JPY Four-Hour Price Chart
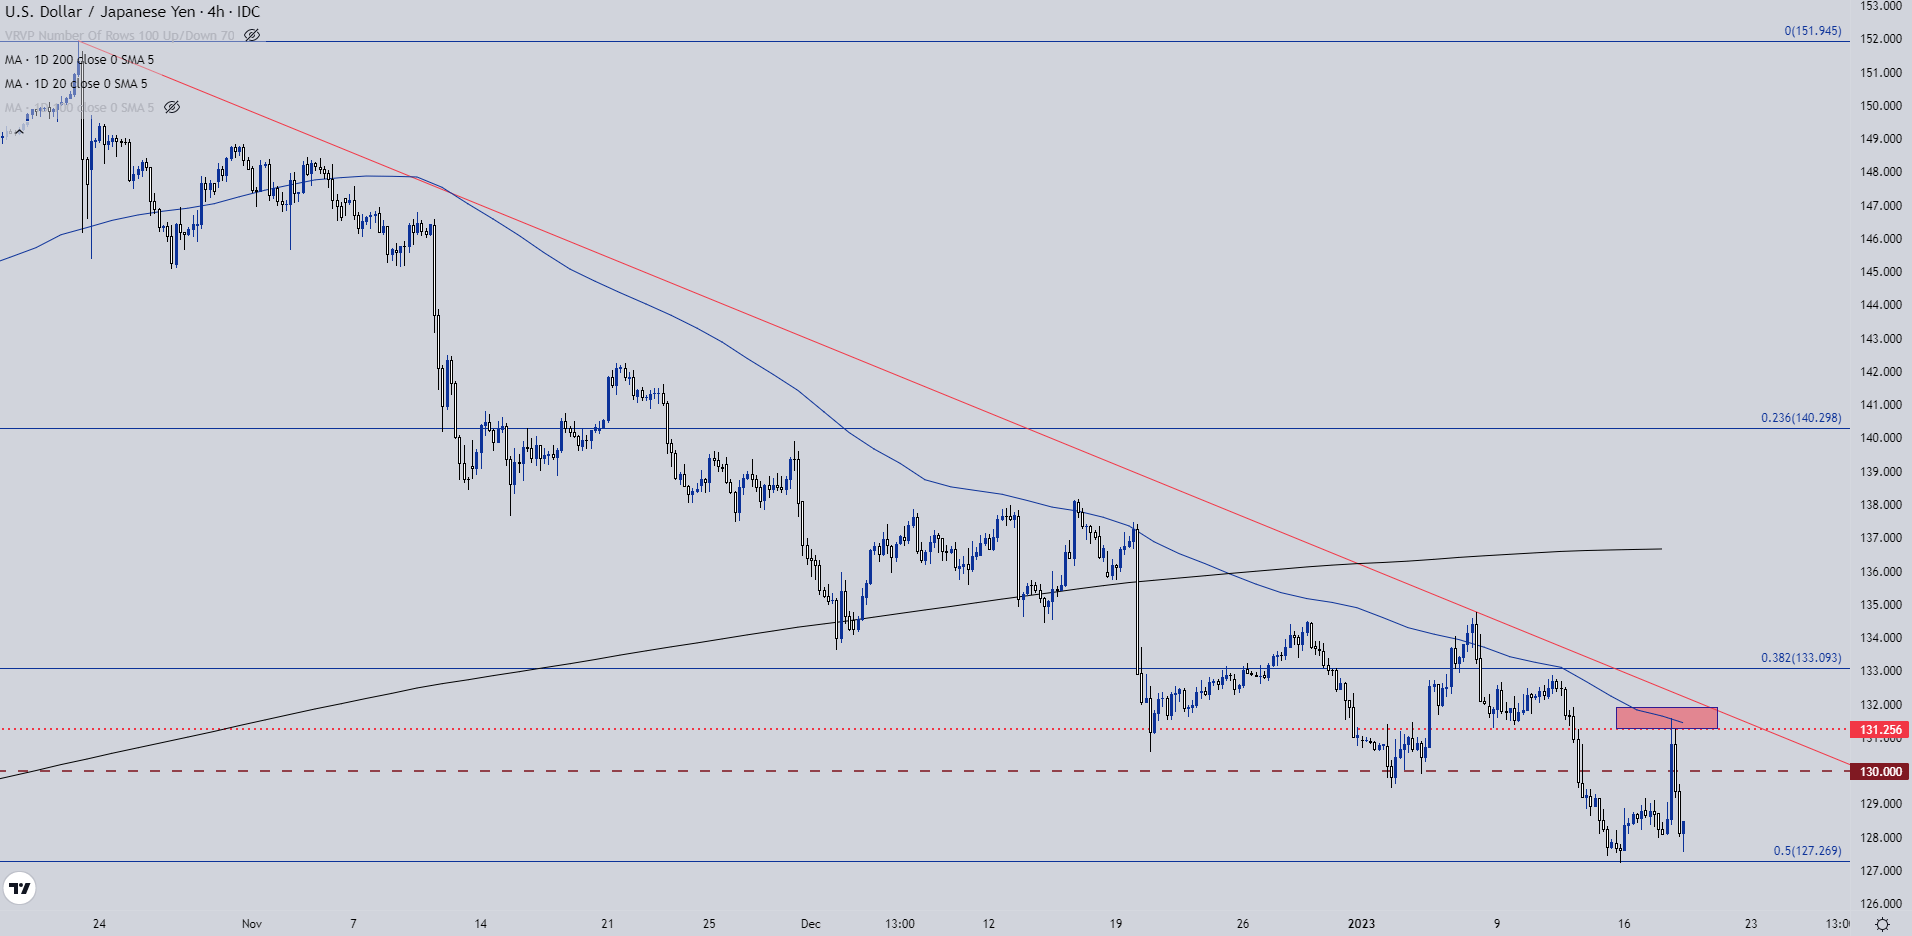
Chart prepared by James Stanley; USD/JPY on Tradingview
EUR/JPY
The daily chart of EUR/JPY is a mess, in my opinion. There are some interesting inflection points both above and below current prices but for the past couple of trading days price action has been grinding in a fairly inconsistent range. This makes the idea of working within the range far less attractive and, instead, puts focus on the breakout, in either direction.
I’m biasing this bearish at the moment for a few different reasons. The first is a longer-term rising wedge that was broken on December 20th, when the BoJ announced their policy review. Follow-through resistance ended up showing at that same spot of prior wedge support, after which a double top formation built. Double tops, like rising wedges, are often approached with the aim of bearish breaks.
The complication at this point is the near-term noise. But, if price action breaches the neckline of the formation at 137.39, the door opens for bears. If price instead breaks above the double top at 142.94, the formation is invalidated and, in that scenario, there’s likely considerable Yen-weakness to work with, both in EUR/JPY and elsewhere.
EUR/JPY Daily Price Chart
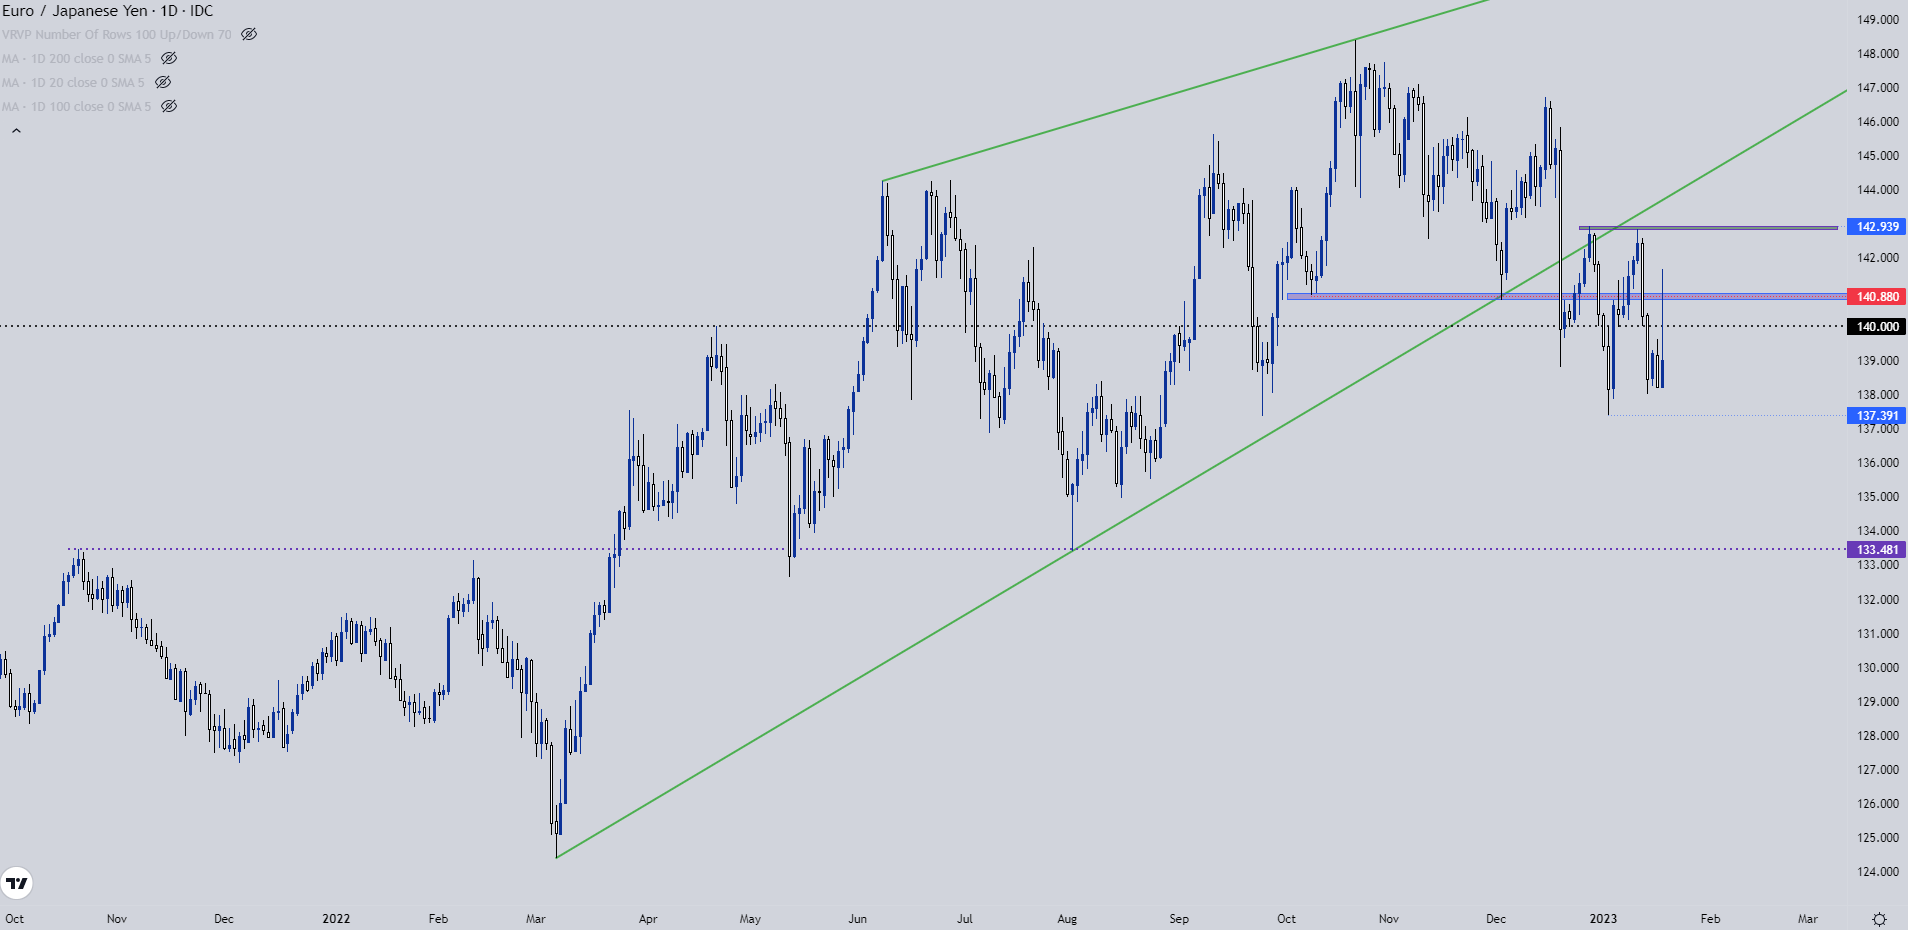
Chart prepared by James Stanley; EUR/JPY on Tradingview
GBP/JPY
GBP/JPY went into last night’s BoJ meeting after having tested a massive spot of support over the past couple of weeks. This is an approximate 100 pip zone from a Fibonacci level at 156.38 down to the early-January low of 155.36.
This zone has had quite a bit of historical relevance, helping to set the highs in 2017 before coming back with a similar purpose in early-2021 trade. It held a support inflection in May of last year before coming back in-play last September during the collapse in the British Pound. It was back in the equation last night and helped to lead into a strong bounce after the BoJ made no changes to policy.
Recommended by James Stanley
Get Your Free Top Trading Opportunities Forecast
GBP/JPY Weekly Chart
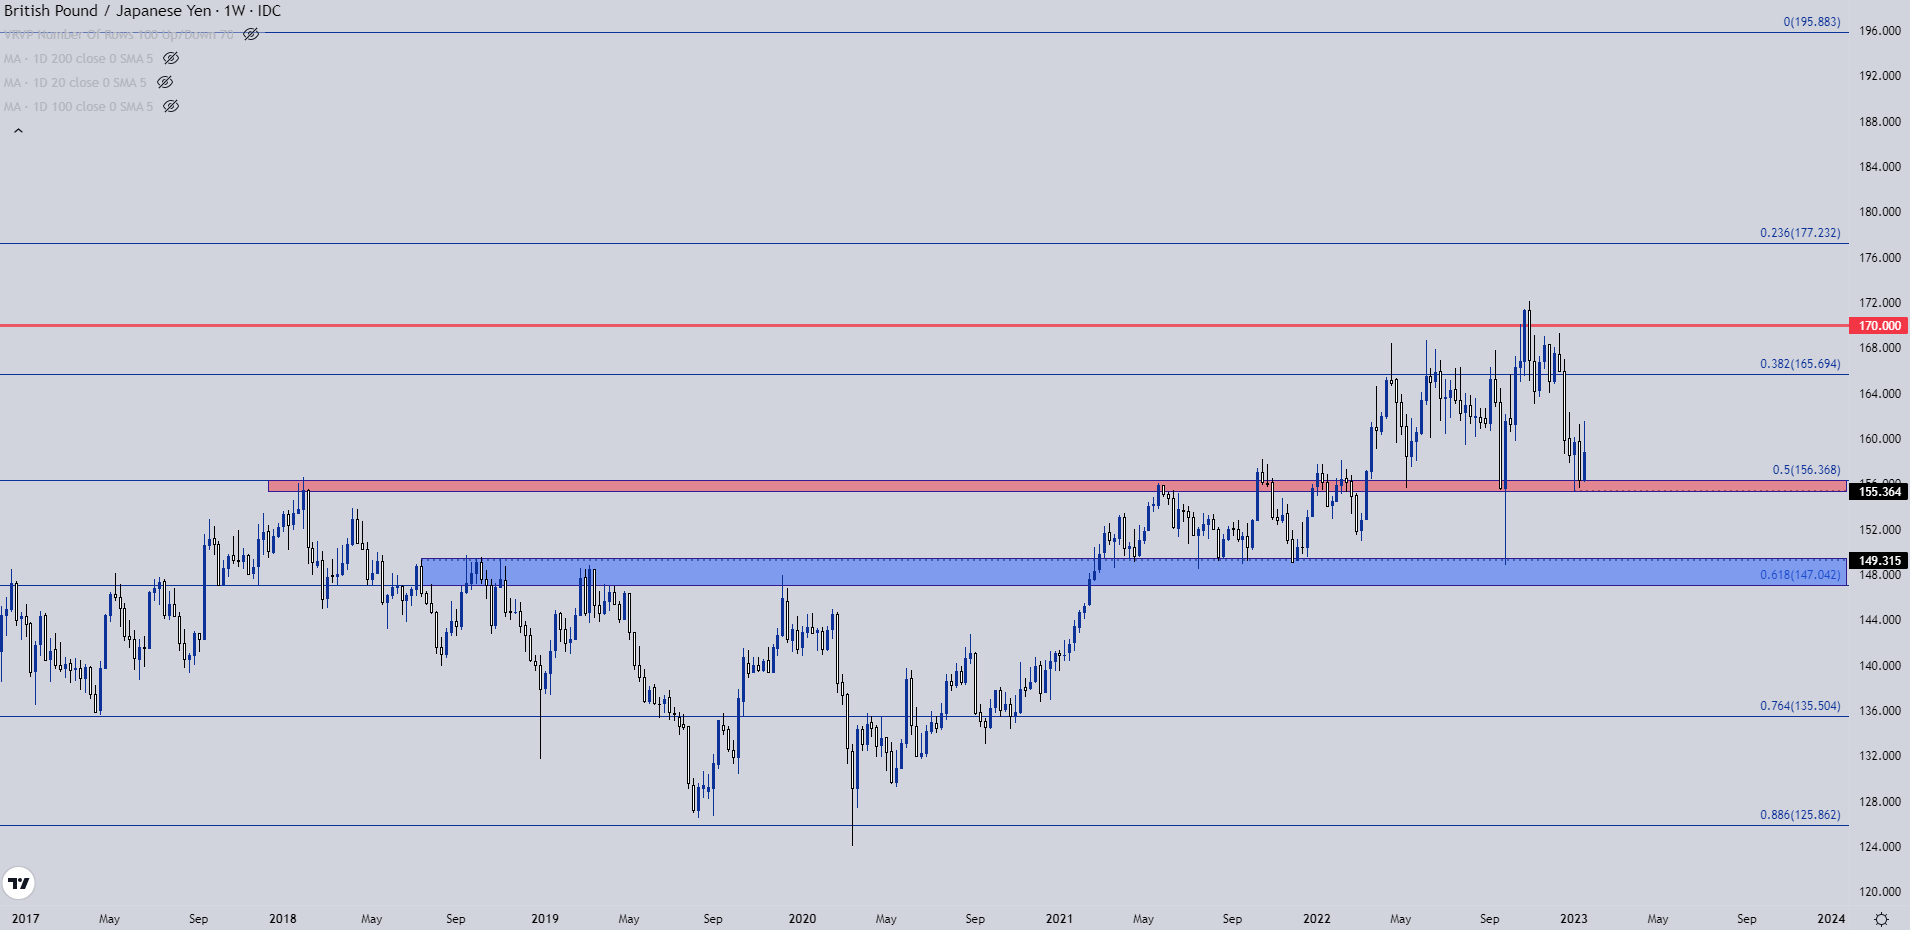
Chart prepared by James Stanley; GBP/JPY on Tradingview
GBP/JPY Shorter-Term
Going down to the daily chart of GBP/JPY illustrates some recent tendencies towards mean-reversion. The support zone has now held two separate inflections and there’s three spots for possible resistance swings sitting overhead, plotted at 162.34, 163.07 and then 164.05.
If sellers are able to pose a breach of the support zone at 156.34-157.37, the next major area of support on the chart is the blue zone in the above image, which has held the lows in GBP/JPY since March of 2021, including during last September’s sell-off when Yen-strength was beginning to come online around the same time that the British Pound went into a collapse-like move.
GBP/JPY Daily Price Chart
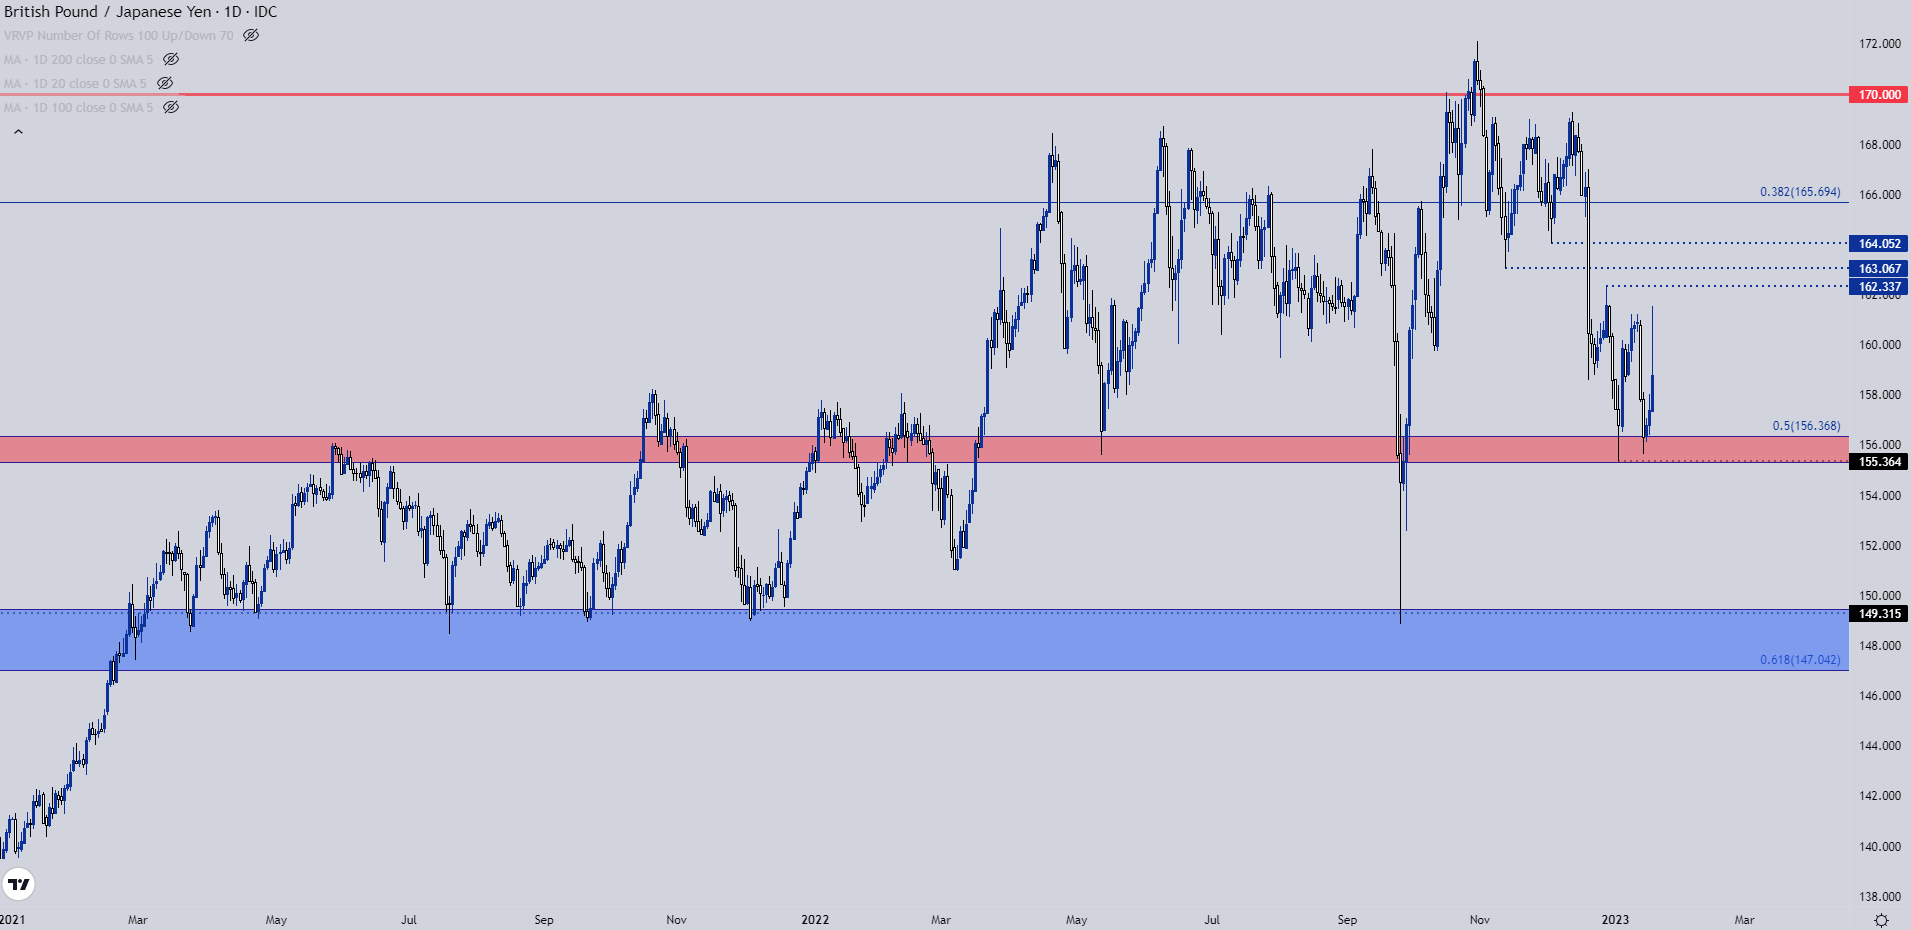
Chart prepared by James Stanley; GBP/JPY on Tradingview
— Written by James Stanley
Contact and follow James on Twitter: @JStanleyFX
[ad_2]
Source link