
[ad_1]
US Dollar Technical Forecast: Neutral
- US Dollar DXY poised to retest 2022 high if prices break above wedge resistance
- GBP/USD may continue its wedge breakout if prices can clear the 50-day SMA
- USD/JPY fell to its 50-day Simple Moving Average as Yen bulls return to market
DXY Technical Outlook: Neutral
The US Dollar DXY index struggled last week, falling more than half a percent, adding to losses from the prior week and dropping to the lowest level since July 5. A prior level of resistance around 105.5 appeared to underpin prices. However, the downward trend over the past couple of weeks has formed a Falling Wedge pattern.
That could put prices on a bullish path if DXY breaks above the wedge’s resistance level. A run back up to the 2022 high at 109.29 would be on the cards if that occurs. Alternatively, a drop back to the 50-day Simple Moving Average is possible if prices break below the wedge. That SMA supported prices in May and June and may do so again if prices fall.
DXY 8-Hour Chart
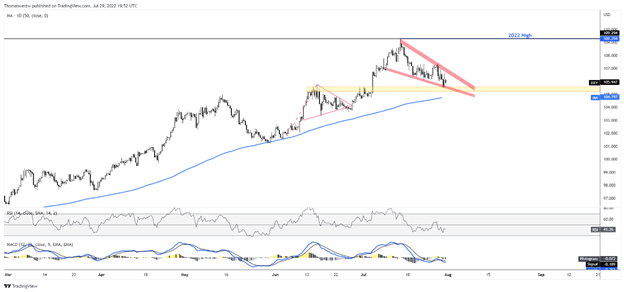
Chart created with TradingView
GBP/USD Technical Outlook: Neutral
GBP/USD put in a strong performance last week, rising over 1% to its highest level since June. Prices rose above Falling Wedge resistance earlier this month, with prices extending higher since. The falling 50-day Simple Moving Average (SMA) capped gains on Friday after an intraday attempt to clear the moving average failed.
A pullback to the June low at 1.1932 may be on the cards if that moving average holds as resistance. The MACD oscillator is nearing a cross above its centerline, which would constitute a bullish development, although the Relative Strength Index (RSI) is cooling and may turn back towards its midpoint. The technical outlook for the week ahead looks neutral.
GBP/USD Daily Chart
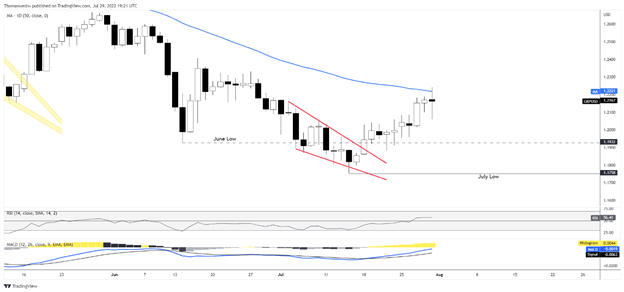
Chart created with TradingView
USD/JPY Technical Outlook: Neutral
USD/JPY fell to its 50-day Simple Moving Average (SMA) last week, a level not traded at since late May. The moving average supported prices back in May and is appearing to do so again as we head into a new week of trading. A break lower would represent a significant technical development since the cross hasn’t traded below the SMA consistently, being a period of more than one week, since early 2021.
That said, USD/JPY’s direction likely hinges on this SMA. A break low may see the Japanese Yen extend strength, pushing prices down to 131.34, where resistance turned to support earlier this year. The MACD oscillator, meanwhile, is on track to cross below its midpoint, which would constitute a bearish development.
USD/JPY Daily Chart
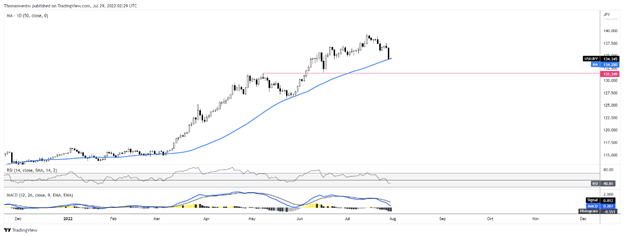
Chart created with TradingView
— Written by Thomas Westwater, Analyst for DailyFX.com
To contact Thomas, use the comments section below or @FxWestwater on Twitter
[ad_2]
Source link