
[ad_1]
US Dollar, EUR/USD, AUD/USD, USD/JPY, GBP/USD – Weekly Technical Outlook
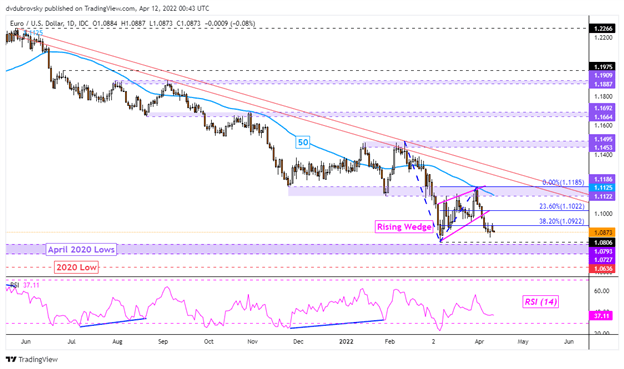
EUR/USD – Bearish
The US Dollar extended gains against the Euro this past week, reversing losses seen throughout March. EUR/USD also broke under a bearish Rising Wedge chart formation, opening the door to resuming the broader downtrend in the week ahead. Still, this requires taking out the March low at 1.0806, exposing the 1.0772 – 1.0793 support zone.
The latter is composed of lows from April 2020. Shortly beyond that is the 2020 low at 1.0636. In the event of a turn higher, immediate resistance appears to be the 38.2% Fibonacci extension at 1.0922, with the 23.6% level beyond that at 1.1022. Down the road, the 50-day Simple Moving Average (SMA) may maintain the broader downside focus.
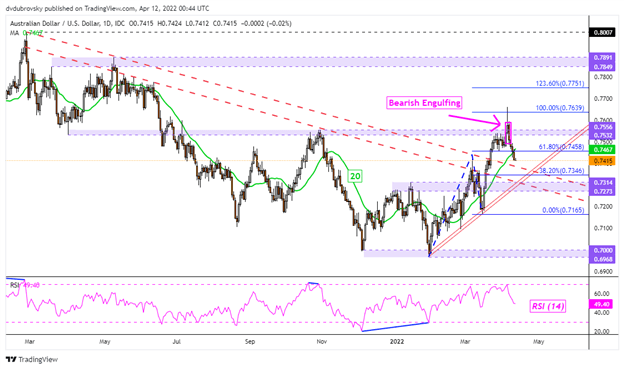
AUD/USD – Bearish
The US Dollar also pushed higher against the Australian Dollar this past week. This is as AUD/USD left behind a Bearish Engulfing candlestick formation. Since then, there has been downside follow-through, opening the door to extending losses. Still, prices recently pierced the 61.8% Fibonacci extension at 0.7458, as well as closing under the 20-day SMA, opening the door to further losses.
This is now placing the focus on a rising trendline from the beginning of February. The latter could then reinstate the upside focus since the end of January. If not, that would expose the March 15th low at 0.7165. In the event the pair attempts to resume the uptrend since January, pushing above the 0.7532 – 0.7556 inflection zone exposes the 100% extension at 0.7639.
USD/JPY – Bullish
The US Dollar extended gains against the Japanese Yen this past week, with USD/JPY closing at its highest since August 2015. On Monday, the pair set a new 2022 high, stopping just under 2015 peak at 125.856. Closing above the latter brings levels from 2002 into focus. That is when the midpoint and 61.80% Fibonacci extension levels at 126.634 and 127.896 near, respectively.
In the event of a turn lower, keep a close eye on the 20-day SMA, which could reinstate an upside focus. That may become a possibility if prices take out the former resistance zone (123.862 – 125.108). Beyond the latter is the late March low at 121.49. Confirming a breakout under the latter may shift the outlook increasingly bearish, placing the focus on the midpoint of the Fibonacci retracement at 119.758.

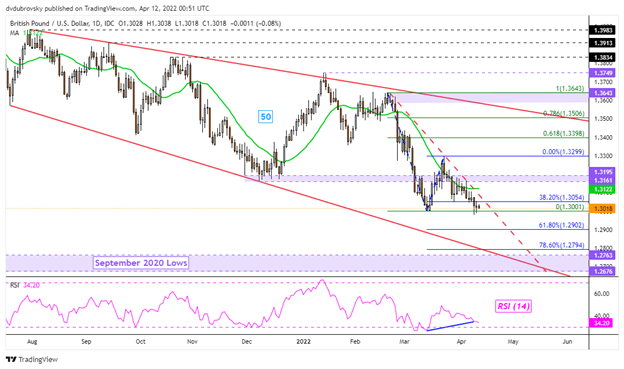
GBP/USD – Bearish
The US Dollar extended gains against the British Pound this past week, sending GBP/USD lower as it continued to fall in line with the broader downtrend since 2021. Still, prices were unable to clear the March low at 1.3001 on Monday, with prices leaving behind an indecisive Doji candlestick pattern. Positive RSI divergence does show that downside momentum is fading, which can precede a turn higher.
Such an outcome could place the focus on the falling trendline from the end of February, which could reinstate the downside focus. Beyond that is the 1.3161 – 1.3195 inflection zone before the 50-day SMA kicks in. Resuming the downtrend exposes the 61.8% Fibonacci extension level at 1.2902 before the 78.6% level at 1.2794 kicks in.
— Written by Daniel Dubrovsky, Strategist for DailyFX.com
To contact Daniel, use the comments section below or @ddubrovskyFX on Twitter
[ad_2]
Source link