
[ad_1]
A fundamental imbalance exists between Wall Street “buys” and “sells.” For example, how should an investor interpret a recent upgrade of DoorDash stock and the downgrades of both Dropbox and PayPal Holdings?Logically, the ratings downgrades are probably a bad omen for Dropbox
DBX,
and PayPal Holdings
PYPL,
but DoorDash’s
DASH,
upgrade? It means less. That’s because a Wall Street downgrade is a lot rarer, and therefore carries more significance than an upgrade.
According to FactSet, just 5.6% of current Wall Street analyst ratings of S&P 500
SPX
companies are in the “sell” category. That’s about one-tenth of the 54.4% of such companies with “buy” ratings, as you can see from the accompanying chart.
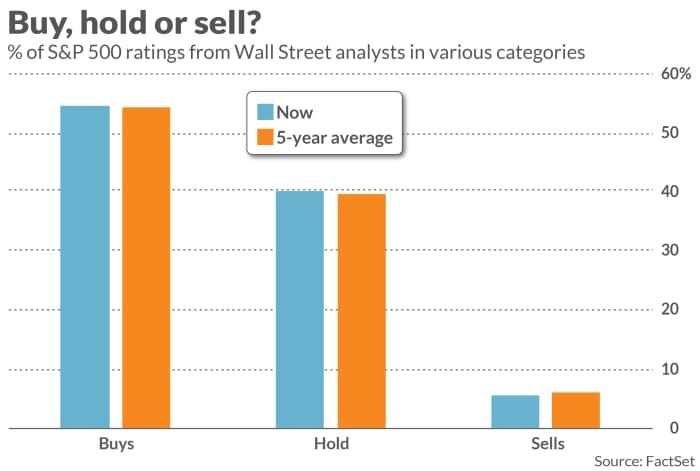
Don’t assume that the lopsided plurality of “buys” over “sells” is bullish. As you can also see from the chart, there’s nothing particularly unusual about the much greater proportion of “buy” ratings than “sells;” the current percentages are almost precisely equal to the five-year average.
This imbalance was supposed to be corrected by a rule the National Association of Securities Dealers adopted in 2002 (Rule 2711), requiring firms to disclose the proportion of their stock ratings that fell into the categories of buy, hold and sell. (NASD rule 2711 was superseded in 2019 by FINRA rule 2241 that has a similar disclosure requirement.) It was hoped that firms would be shamed into being more balanced with their “buys” and “sells” when having to report how exaggeratedly bullish they were.
Apparently, Wall Street firms have only limited susceptibility to being shamed. Prior to Rule 2711 going into effect, the percentage of “buy” ratings for S&P 500 companies from Wall Street analysts fluctuated in a range between about 60% and 80%, according to FactSet data. That range shifted downwards by about 15 percentage points after 2002, while the range of “sell” ratings shifted upwards by about three percentage points. That still left about 10 times as many “buys” than “sells.”
Even while being only minimally successful in reducing the buy-sell imbalance, these disclosure requirements may have had the counterintuitive effect of reducing the significance of a Wall Street “buy” rating. According to a study conducted by two researchers at South Korea’s Yonsei University, since 2002 the stocks upgraded by Wall Street analysts have not outperformed the stock market, on average. Prior to 2002 they did.
Downgraded stocks still have significantly underperformed, according to the researchers. So it still makes sense to pay attention to Wall Street analysts’ ratings, but you may want to focus more on their downgrades than their upgrades.
With that thought in mind, below is a list (courtesy of FactSet) of S&P 500 stocks with the greatest percentage of analyst ratings in the “sell” or “underweight” categories. The list of 11 stocks contains those for which this percentage is at least 30% — which is far higher than the percentage across all S&P 500 companies of just 5.6%.
| Stocks | % of ratings in the “Sell” or “Underweight” categories |
| Expeditors International of Washington, Inc. (EXPD) | 50% |
| Franklin Resources, Inc. (BEN) | 50% |
| T. Rowe Price Group (TROW) | 47% |
| Robert Half Inc. (RHI) | 41% |
| Clorox Company (CLX) | 40% |
| Hormel Foods Corporation (HRL) | 36% |
| Paramount Global Class B (PARA) | 35% |
| Consolidated Edison, Inc. (ED) | 35% |
| Principal Financial Group, Inc. (PFG) | 35% |
| Packaging Corporation of America (PKG) | 33% |
| C.H. Robinson Worldwide, Inc. (CHRW) | 32% |
Mark Hulbert is a regular contributor to MarketWatch. His Hulbert Ratings tracks investment newsletters that pay a flat fee to be audited. He can be reached at mark@hulbertratings.com
[ad_2]
Source link